
Displaying items by tag: israel
The Oil War on Your Plate: How Iran War Is Causing Global Food Crisis 2026

The Oil War on Your Plate: How Iran War Is Causing Global Food Crisis 2026
After a Pakistan-brokered ceasefire briefly calmed markets last week, the Islamabad talks collapsed on two irreconcilable points: Iran's insistence on controlling the Strait of Hormuz and its refusal to dismantle its nuclear program. Trump called it "a really good meeting, except for the one thing that really mattered."
The Strait of Hormuz is still closed. And now, the US has moved from diplomacy to naval blockade.
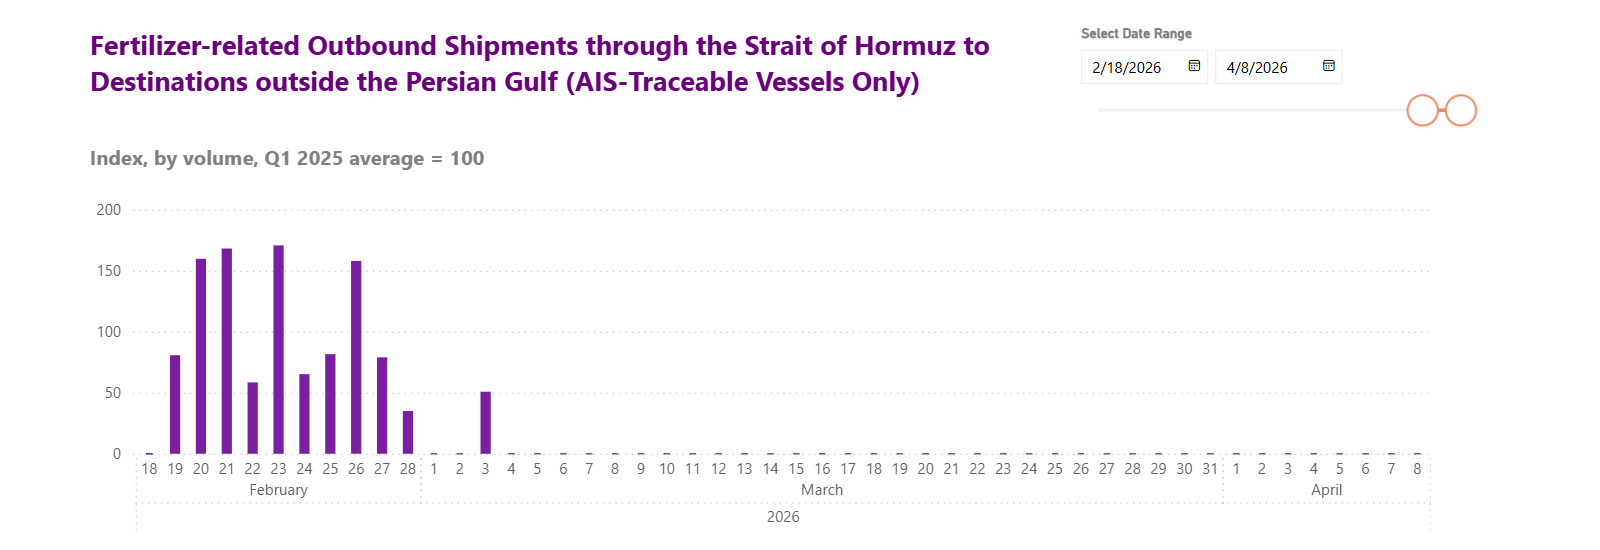
The Strait of Hormuz food supply route, through which 27% of global oil exports, 20% of LNG, and up to 30% of the world's fertilizer trade flows, has been functionally impaired since February 28.
Does oil war cause food shortage? The answer is Yes.
Urea fertilizer is still 50% more expensive than pre war levels. The Northern Hemisphere's spring planting window is closing with farmers short on nitrogen they cannot source or afford. And the supply chain disruption, slow-moving, invisible, and already in motion, will take 6 to 12 months to fully surface in harvest yields, grocery prices, and hunger statistics.
This article is about that oil war food crisis 2026. What the oil war has already done to the global food system, and what happens to your grocery bill, and to 45 million people on the edge of acute food insecurity, if situation goes further wrong.
How Oil Becomes Food?
Most people know that higher oil prices mean higher gas prices. What far fewer people understand is that oil impact on food supply chain runs far deeper. Oil doesn't just move food, it fundamentally makes it. There are three different channels through which an oil price shock reaches your dinner table, and they operate on very different timelines.
1- Transportation:
Diesel powers every truck, ship, and train that moves food from farm to processor to warehouse to shelf. Higher fuel costs hit first and compound at every single handoff in the food supply chain.
2- Fertilizer:
Nitrogen fertilizers are made from natural gas and oil-linked commodity. Energy price spikes drive fertilizer price spikes. However, this channel has a 6–12 month delay before it shows up in harvest yields and food production costs.
3- Biofuels:
When crude is expensive, biofuel crop diversion food crisis becomes more profitable. Governments divert corn, palm oil, and soybeans into energy instead of food. Hence, it causes tight global grain supplies and ultimately drives up food prices across the board.
Now Why Your Grocery Bill Hasn't Peaked Yet?
If you are wondering how does oil price affect grocery prices in practice, the answer is: slowly, then all at once.
A 2025 analysis from the Federal Reserve Bank of Kansas City confirmed what any supply chain analyst will tell you: a 10–20% oil price increase doesn't translate one-for-one into grocery prices right away. Rather, the full effect takes months to work through multiple layers of the system. But when it does arrive, food inflation is stickier and harder to reverse than energy prices. And the fertilizer channel's 6–12 month delay means the worst of this year's shock is still ahead of us.
What’s the Fertilizer Crisis?
While crude oil prices dominate the headlines, the smarter money is watching fertilizer prices 2026. And what its showing should alarm anyone who eats. The situation is arguably worse than the oil crisis, because there is no emergency release valve for fertilizer shortages and just like other shipments, fertilizer shipments are also blocked at the strait, making the Hormuz blockade food supply chain disruption far more dangerous than most realize.
The cost of FOB granular urea in Egypt, which is the global bellwether for nitrogen fertilizer prices, has jumped from $400–$490 per metric ton before the war to around $700 per metric ton. Oxford Economics reports that urea prices agriculture 2026 are up roughly 50% and ammonia around 20% since February 28. In the United States, urea at the New Orleans import hub jumped 32% in a single week, from $516 to $683 per metric ton, with prices up 77% from mid-December 2025. Timing couldn't be worse, because, this is peak spring planting season.
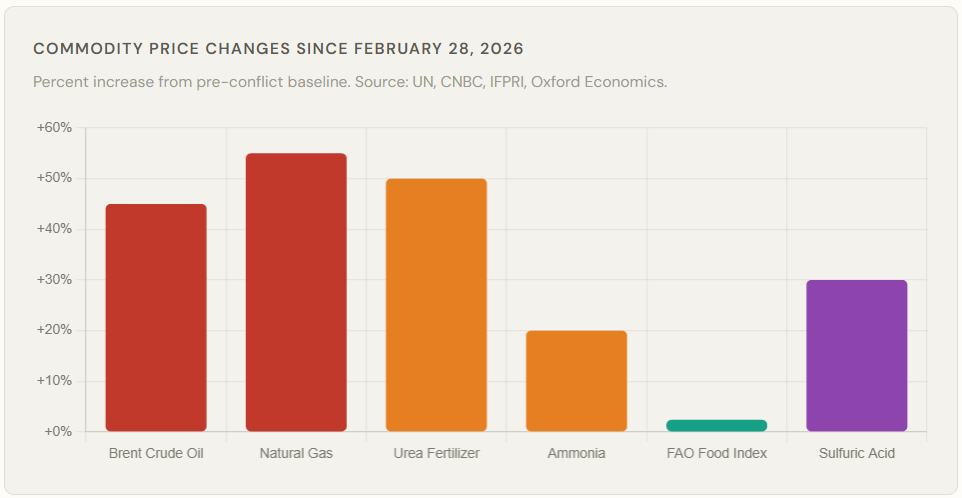
What makes fertilizer prices so catastrophic is structural. Countries hold strategic petroleum reserves which means, governments can release oil to buffer a supply shock. In contrast, there is no strategic fertilizer reserve anywhere on the planet. No bypass pipeline for urea. No OPEC-equivalent that can ramp production overnight. Therefore, Hormuz crisis is really two crises sharing one waterway, and the fertilizer crisis has absolutely no shock absorber.
According to IFPRI, the Middle East controls an outsized portion of the global fertilizer market, with Saudi Arabia, Iran, Qatar, Kuwait, and the United Arab Emirates exporting 36% of global urea shipments, nearly 50% of global sulfur trade, and 25% of ammonia worldwide. In contrast to the Russia/Ukraine war, which had impacted only one or two big producers of fertilizer, this conflict has affected all of them at once, therefore causing food insecurity.
Food Prices Overview
Data is starting to move – and it's all in the same direction. Will food prices go up because of Iran war? They already have.
According to the UN Food and Agricultural Organization (FAO), there has been a 2.4% increase in its FAO Food Price Index 2026 in March alone, the biggest single-month increase since 2022. Food cereals prices increased around 1.7% month-on-month, with the sole driver behind the move being increased fertilizer and energy prices, causing Iran war food inflation.
In addition, according to USDA projections, there will be 3.6% of overall food price increases in 2026, with beef being 14.4% costlier compared to last year as of February. Eight of 15 food-at-home categories in the USA are currently experiencing annual growth rates above their historical averages of the past 20 years.
What's more important, according to FAO's forecast, if fertilizer use decreases due to the high costs, the next round of harvest would be reduced, triggering harder food price wave during the latter part of 2026. This is not a forecast; this is agricultural math.
Who is at Most Risk?
Not all countries will feel this food security oil price shock equally. The vulnerability will depend on three primary factors: dependence on food imports, exposure of the energy sector to changes in global oil price dynamics, and, crucially, how much of the household budget is used to purchase food items.
The lower the income level, the higher the vulnerability of this population. The pattern of food inflation Middle East 2026 data already confirms this — and for developing countries food oil shock exposure, the situation is especially acute.
|
Region / Country |
Food as % of Income |
Primary Exposure |
Risk |
|
Sub-Saharan Africa |
50–70% |
Grain imports, fertilizer access, currency weakness |
Critical |
|
South Asia (India, Pakistan, Bangladesh) |
45–60% |
Heavy LNG & fertilizer imports from Gulf; thin reserves |
Critical |
|
Gulf States (food importers) |
30–45% |
90%+ food import dependency; Hormuz is their supply lane |
Critical |
|
Europe |
12–20% |
Diesel, jet fuel & fertilizer sourced from Gulf; gas price surge |
High |
|
Latin America (Brazil) |
18–28% |
World's largest fertilizer importer — 49M metric tons in 2025 |
High |
|
United States |
~10% |
Domestic energy buffer; urea import costs hit spring planting hard |
Moderate |
|
China |
~18% |
Large strategic reserves; slower-burning, longer-term exposure |
Moderate-Low |
With the Brent oil price currently standing at $110 per barrel, 55% increase from late-February level of $71, the model suggests food prices may increase by 14%. This means that for families spending 70% of their income on food, food price hikes will equate to a sudden drop of 10% in real income.
And it is not luxury items that get cut first; it's proteins, fruits, and vegetables. When young children under age of five lack food intake, it's a developmental disability that negatively impacts their cognitive ability, education, future earnings and nothing helps.
Historical Relationship Between Brent Crude & Food Price Index
If this situation sounds eerily familiar to you, it is because it is. FRED's data show how the Global Food Price Index moves together with Brent crude through any major geopolitical shock. Be it 2000-2005 energy boom, the food price hike amid the global financial crisis that briefly pushed Brent prices above $147 in 2008, the Arab Spring food riots that triggered further price increase in 2011 or the Russia/Ukraine War in 2022, when Brent surpassed the $120 mark and sent the FAO Food Price Index to an all-time peak.
The following image shows crude oil food prices correlation.
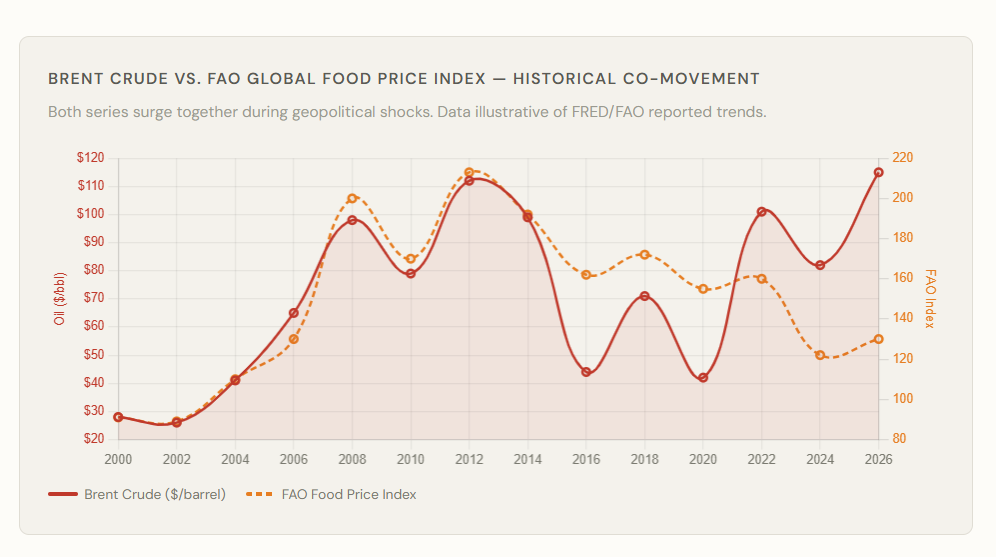
Each episode led to an unfolding food crisis, which was proportional to the duration of energy shock. Brent crude food inflation is not new, but in 2026, the duration of the crisis becomes the critical factor. Analysts suggest that the threat of inexpensive drones to the security of oil supply is what keeps the Strait closed despite multiple ceasefires; and that drone-based threats might linger for months even after launch facilities have been destroyed.
No wall is necessary across the Strait of Hormuz – the lingering threat will keep insurance companies out of business in the region. And this is already happening.
The Stagflation Threat is Real
Currently, the Brent oil price hovers around $100 a barrel. Economic growth forecasts are being revised downward. IMF projects an increase in global inflation and will release a new report on economic impact of war on global economy on April 14th.
This is a classic stagflation scenario: prices rising while growth slowing. The 1973 oil embargo and 1978 Iranian Revolution both started exactly like this – leading to global recession that lasted years.
The Fed finds itself in a dilemma without an easy way out. If the action against a short-lived energy shock occurs too early, this would lead to more problems rather than solve them. But delaying the reaction will allow stagflation food prices – far more stubborn and lasting – to embed itself in the economy.
Three Possible Scenarios for What Comes Next
How bad it gets will depend entirely on whether there will be a ceasefire agreement signed in Islamabad this weekend – and in the weeks to follow. The International Food Policy Research Institute warns of potential disruptions of fertilizer delivery to Asia as the most serious problem, if Hormuz remains closed.
Below are the probabilities of each of three scenarios:
Scenario 1- Ceasefire agreement holds
Pakistan’s Foreign Minister Ishaq Dar is pushing both sides to hold the ceasefire and keep talking. If quiet pressure gets them back to negotiations within days and an agreement lands quickly, the Strait reopens. Oil cools off to around $75–80. Food prices begin to settle, but the damage to spring planting is already locked in, so autumn 2026 harvests still come in below normal. Even in this best-case path, the system carries a few months of built-in strain.
Scenario 2- Partial ceasefire agreement; fragile peace
Both sides stick to a tense, no-shooting truce, but nothing moves diplomatically. The Strait remains effectively shut, and the US port blockade keeps pressure on Iranian exports. Brent hovers in the $95–105 range. Fertilizer stays expensive through the critical planting window. By Q3 2026, food prices jump 8–12% in import-dependent regions. The WFP’s projection of 45 million people facing hunger starts to materialize. Overall, global food security takes a noticeable hit.
Scenario 3 - Ceasefire fails; conflict continues
The US blockade provokes retaliation from Iran, and the Strait stays closed through the summer. Fertilizer shortages during spring planting lock in weaker autumn harvests across Asia and Africa. UN ESCAP estimates the region-wide inflation at 4.6% in 2026. However, this forecast is based on assumption that ceasefire will hold. With it failing, the numbers would deteriorate quickly. Financial models pointing to $150+ oil in a prolonged conflict stop looking extreme and start looking realistic. At that stage, the 2026 global food crisis isn’t hypothetical anymore.
Summary
While this crisis may sound like an energy story, this has never been the case. This is a global food crisis 2026, slowly developing across supply chains, fertilizer invoices, transportation costs, and planting decisions that have yet to be fully priced in.
Tragically, the people who did nothing to ignite this geopolitical dispute are the ones who suffer the most. Usually, an oil war is fought between military forces and diplomats. And a food crisis unfolds among families and in kitchens. But, right now, those two things are the same and falls under one crisis.
Written by: Saman Ali
Disclaimer:
This article is for informational and educational purposes only and does not constitute financial, investment, trading, or legal advice. Always do your own research or consult a licensed advisor before making trading decisions.
Four Outcomes for Oil After the Iran Escalation - From Risk Premium to Route Closure

The oil market doesn’t need actual barrels to go missing to rally—it only needs the credible possibility that barrels might go missing, fast. That’s exactly what traders woke up to this weekend after the latest escalation involving U.S. and Israeli strikes on Iran, and the equally important follow-on: the messaging around the Strait of Hormuz.
By the numbers, the Strait of Hormuz remains the world’s most dangerous energy chokepoint. In 2024, flows through Hormuz averaged about 20 million barrels per day—roughly 20% of global petroleum liquids consumption. When you add the LNG dimension, the concentration risk becomes even uglier: EIA estimates roughly 20% of global LNG trade transited Hormuz in 2024, primarily from Qatar.
So the question for oil isn’t whether geopolitics matter—they always do. The question is whether this episode stays in the familiar lane of “risk premium” or breaks into the lane of “physical disruption.” The difference between those two states is the difference between crude drifting a few dollars higher… and crude gapping violently while refiners and governments scramble for contingency supply.
The market is already paying for risk—and it’s doing it with urgency
Even before the weekend’s latest headlines, crude was already reacting to the broader U.S.–Iran tension. Reuters reported Brent closing around the low-$70s after climbing on supply-risk focus in late February, reflecting a market that had started to reprice tail risk.
What changed with the latest reports is the perceived pathway from tension to disruption. When an EU naval mission official says Iran’s Revolutionary Guards issued radio transmissions indicating ships’ passage through Hormuz was “not allowed,” markets don’t wait for stamped paperwork. They start imagining insurance premiums, rerouting, delays, and the operational chaos that can reduce effective supply even if production hasn’t dropped yet.
Meanwhile, the public diplomacy has turned dark enough that even the UN Secretary-General referenced “reports that Iran is closing the Strait of Hormuz for international shipping” in remarks to the Security Council—language that underscores how seriously this is being treated at the highest levels, even as details remain fluid.
Why a “Hormuz story” is not just a headline story

There’s a common misconception that a Hormuz event must mean a neat, binary closure—open one day, closed the next. In practice, a Hormuz shock can arrive in gradients:
-
Harassment and warning broadcasts
-
Boardings, seizures, or “temporary” safety measures
-
Missile/drone incidents that raise perceived risk
-
Insurance and security costs that change the economics of a cargo
-
De facto disruption where traffic continues but at reduced throughput, longer queues, and higher costs
That spectrum is exactly why oil can spike even without a clear, official declaration. Shipping doesn’t like ambiguity; insurers like it even less. And commodity markets price the marginal barrel—the one that suddenly becomes hard to move—not the average barrel.
What happens to oil next depends on which of four paths we enter
I’ll lay out the scenarios the way a crude desk would think about them: not as predictions, but as tradeable states of the world.
Scenario 1: The “risk premium only” regime (contained, noisy, but flowing)
In this path, strikes and rhetoric persist, but actual exports from the Gulf continue with manageable disruption. Tankers still sail. Refineries still run. The market adds a geopolitical premium, then gradually bleeds it as traders get comfortable that flows are intact.
This is the kind of environment banks and analysts often describe as a limited disruption case. Reuters cited Barclays noting Brent could rise meaningfully if disruptions occur, while also acknowledging the possibility of de-escalation without supply impact; even a ~1 million bpd disruption would matter because it could erase an expected surplus.
Oil implication: Brent likely holds a firmer floor, rallies on alarming headlines, sells off on “no impact” evidence—classic whipsaw. Volatility stays elevated. The curve may tighten (near-term barrels bid), but not explode.
Scenario 2: Iran’s own supply constrained (sanctions-plus or infrastructure shock)
The market can absorb a lot of geopolitical drama until it touches the plumbing. If Iran’s production, storage, loading terminals, or export logistics are impaired—whether by direct hits, cyber, sabotage, or tighter enforcement—then you’re into a more tangible deficit narrative.
The key is psychology: even if headline export numbers don’t collapse, uncertainty can force buyers to seek alternatives, pushing differentials wider and tightening prompt supply.
Oil implication: Expect a stronger bid in the front of the curve, with heavier strength in sour grades if those barrels become harder to source. Refiners (especially in Asia) may pay up for substitutes.
Scenario 3: “De facto Hormuz disruption” (partial throughput loss, insurance shock, rerouting)
This is the scenario the market fears because it doesn’t require a dramatic announcement—only persistent risk. The Reuters report about warning transmissions is the kind of catalyst that can push underwriters and shipowners into defensive behavior.
Even if only a portion of traffic slows, the effect can be nonlinear. Cargo timing matters. Refiners are inventory businesses. A few delayed cargoes can trigger aggressive spot buying elsewhere.
Oil implication: A larger and more durable risk premium. Tanker rates and freight spreads rise; delivered costs jump. Brent can move sharply even if global production is unchanged, because “available oil” becomes “available delivered oil.”
Scenario 4: The nightmare tail—attempted closure of the Strait of Hormuz
If Iran truly attempts to block Hormuz in a sustained way, the immediate market problem is not forecasting; it’s triage. The EIA’s numbers tell you why: Hormuz is not a niche route—it’s a central artery, moving about 20 million bpd.
This is where you stop talking about $3–$5 moves and start talking about discontinuous pricing—because the world cannot quickly replace that transit capacity. Some barrels can reroute through pipelines, some can be drawn from storage, some can be offset by demand destruction. But none of those are instant, and markets trade the first 72 hours brutally.
Oil implication: A potential price shock that is measured in tens of dollars, not single digits, depending on duration and the credibility of enforcement. Volatility spikes across crude, refined products, and freight. Central banks start paying attention again.
Can OPEC “fix it”? Only partially—and not immediately
In theory, spare capacity is the fire extinguisher. In practice, spare capacity is political, operational, and not all barrels are equal.
A commonly cited estimate from the International Energy Agency (reported by Reuters) put OPEC spare capacity around 5.3 million bpd, with Saudi Arabia ~3.1 million and the UAE ~1.1 million (as of early 2025 context).
But even if you accept the headline number, spare capacity doesn’t solve Hormuz if the problem is transit. You can pump more oil, but if ships can’t move safely—or insurance makes it uneconomic—then “capacity” becomes theoretical. Also, spare barrels often differ in quality from what refiners are configured to run, and the ramp-up isn’t a light switch.
Bottom line: OPEC can cushion a supply shock; it can’t instantly neutralize a shipping chokepoint shock.
The U.S. SPR and coordinated stock releases: a pressure valve, not a cure
Strategic reserves are designed for a moment like this—buffering short-term disruption and calming panic. But again: SPR is a bridge, not a replacement for a functioning trade route. It buys time for rerouting, for diplomatic openings, for demand response, and for non-OPEC supply to react. It doesn’t restore Hormuz.
If the market senses policymakers are willing to act early, it can cap the extreme top. If the market senses hesitation, it will do what it always does: price the worst first, then walk it back later.
Secondary impacts traders will underprice at first—and then chase
Even if crude becomes the headline, the knock-on effects can be just as market-moving:
-
Refined products
Diesel and jet fuel often react more violently than crude in disruption scares because logistics and refinery margins matter. Airlines and shipping lines become immediate pressure points. -
Shipping and insurance
Freight can become a second oil shock layered on top of the first. In stress, delivered prices diverge sharply by region. -
Natural gas / LNG
With a large share of LNG trade flowing through Hormuz (especially Qatari volumes), gas markets can seize up, pushing fuel switching demand back toward oil in some regions. -
FX and rates
Oil exporters’ currencies can catch a bid; oil importers can suffer. Higher oil also complicates inflation narratives—especially if the shock looks persistent.
What to watch now: the “tells” that separate panic from a real supply crisis
If you want to write like a market person, you don’t just repeat headlines—you monitor the tells:
-
Shipping behavior: Are tankers queuing? Are owners refusing charters? Are AIS gaps increasing?
-
Insurance pricing: War-risk premiums are one of the fastest truth-serums in geopolitics.
-
Physical differentials: If prompt differentials blow out, that’s the market screaming “real tightness,” not just paper fear.
-
Forward curve: A true supply shock usually drives backwardation—front month surging relative to later months.
-
Official signals: Naval advisories, port status, and government statements matter more than social media fragments.
And, crucially: watch whether the situation drifts toward a long, messy “gray zone” in the Strait—because markets can live with a one-off spike, but they struggle with chronic uncertainty.
A sober conclusion: oil can rally on fear, but it only stays high on facts
Right now, the oil market is straddling two realities. One is familiar: geopolitical risk premium, elevated volatility, headlines that move futures more than tankers. The other is rarer: the prospect that the world’s most important chokepoint becomes contested in a way that changes physical flows.
Reuters reporting has already put the two key ingredients on the table: the escalation itself and the very specific Hormuz messaging that makes shipping nervous. And the EIA numbers explain why the market can’t shrug this off: Hormuz is not a side road—it’s the highway.
For traders and investors, the disciplined approach is not to marry a single narrative. It’s to treat this as a scenario market:
-
If flows hold: oil likely carries a premium, but spikes can fade.
-
If exports degrade or shipping slows: oil can reprice higher and stay nervous.
-
If Hormuz becomes functionally impaired: price discovery gets ugly fast.
In other words, this isn’t just about Iran. It’s about the market confronting, once again, the uncomfortable truth that global energy security is still built around a few narrow maritime corridors—and when those corridors come into question, oil doesn’t move like a commodity. It moves like a stress test.
MARKET SNAPSHOT | ENERGY RISK PRICING SHIFTS FROM “HEADLINES” TO “TRAFFIC”
-
Shipping behavior: Reuters cited major oil, fuel and LNG players suspending shipments via Hormuz, with satellite/tanker-tracking indicators showing vessels pausing near key regional ports; multiple LNG tankers reportedly slowed, stopped, or altered course.
-
Regulatory/advisory tone: Greece advised Greek-flagged ships to avoid the Gulf/Hormuz area and flagged risks including missile/drone attack, harassment, electronic interference and navigational disruption.
-
On-the-water signal: Reuters reported an EU naval mission official saying the IRGC transmitted that passage was “not allowed”—a message that can trigger war-risk premia even without a formal closure notice.
-
Why the market cares: EIA estimates flows through Hormuz represent about one-fifth of global oil and petroleum product consumption and about one-fifth of global LNG trade (2024), heavily Asia-bound—meaning the shock is global, but Asia takes the first hit.
-
Shock absorbers (limits apply): Reuters (IEA estimate) puts OPEC spare capacity around 5.3 mb/d (Saudi ~3.1; UAE ~1.1), but spare capacity doesn’t solve a transit problem if ships can’t move.
-
Street view: Barclays flagged Brent could reach $80 if supply is disrupted; it also noted that absent disruption, prices could fade as risk premium leaks out.
Markets are now trading probabilities: contained tensions, de facto delays, export disruptions, or a Hormuz shutdown attempt.


