
Displaying items by tag: nasdaq
How the Iran Conflict Is Impacting the Dollar, Gold, Oil, Stocks, and Treasury Markets

How the Iran Conflict Is Impacting the Dollar, Gold, Oil, Stocks, and Treasury Markets
In just five trading sessions, markets went from debating Fed cuts to preparing for possible rate hikes in 2027. Behind that shift: exploding war costs, a 6.0% PPI shock, and a dollar that refuses to weaken.
In this article, we discuss the impact of Middle East tensions on markets, how defense spending affects the economy, why the Fed may not cut rates in 2026, why the dollar is strengthening again, Key DXY levels to monitor, and why gold is falling despite inflation.
Pentagon Raised Warning of Increased War Costs
According to the Pentagon's testimony to Congress, the ongoing Operation Epic Fury has already cost American taxpayers $29 billion so far this year. In other words, the cost of the US-Iran conflict increased by $4 billion just in two weeks' time. Pentagon's acting comptroller Jay Hurst says that roughly $24 billion of those expenses were needed to repair and replace the equipment destroyed by the war. "But we have a lot of unknowns there," says Hurst, referring to expenses for repairs at US military bases damaged in the fighting.
How does the Iran war affect the US dollar? Fiscal impacts from such a large-scale conflict are not to be ignored, especially when the Department of Defense is now trying to push for an extra $1.5 trillion for US defense budget 2027. At the same time, Republican congressman and head of the House defense subcommittee Ken Calvert asked whether the operation would have a negative impact on US military readiness over the long term.
These concerns show the first signs of a hawkish shift in fiscal policy among fellow Republicans who stand alongside the White House. In other words, war spending will lead to widening budget deficits and a growing supply of US government bonds, causing further crowding out effects for private investment.
In addition to fiscal impacts, there is an even faster one that is likely to come through the channel of energy.
How Iran War is Impacting US Inflation and Fed Decisions?
April CPI came in at 3.8% y-o-y, which is the highest figure since May 2023 and above the consensus forecast of 3.7%. Meanwhile, the rise in energy costs was as high as 17.9% y-o-y, while gasoline prices increased by 28.4% y-o-y, and fuel oil prices by 54.3% y-o-y. What is especially concerning to investors: core CPI, excluding food and energy, jumped 0.4% m-o-m and 2.8% y-o-y, above expectations.
But that was nothing compared to today's print. The latest PPI reading stood at 6.0% y-o-y and crushed the consensus estimate of 4.9%. Month-over-month change in producer prices also skyrocketed, reaching 1.4% and almost three times exceeding the anticipated 0.5% increase. What does it mean? If producer prices continue to grow at such a fast pace, the inflationary pressure in the consumer sector remains intact as well. Excluding food, energy, and trade, core PPI increased by 0.6% m-o-m and 4.4% y-o-y. Read our latest analysis to learn more about oil war’s impact on food prices.
Now to answer the question; Will the Fed cut rates in 2026?It doesn't really require deep expertise in economics to realize that this data kills the whole idea of rate cuts in H2 2026. Bank of America recently moved its projections for the first rate cut to H2 2027. According to the CME Fed Watch index, currently, zero chances are seen for rate cuts in 2026, while 70+ percent probability stands for a rate hike in April 2027. In terms of interest rates, this represents an enormous re-pricing over just five trading sessions.
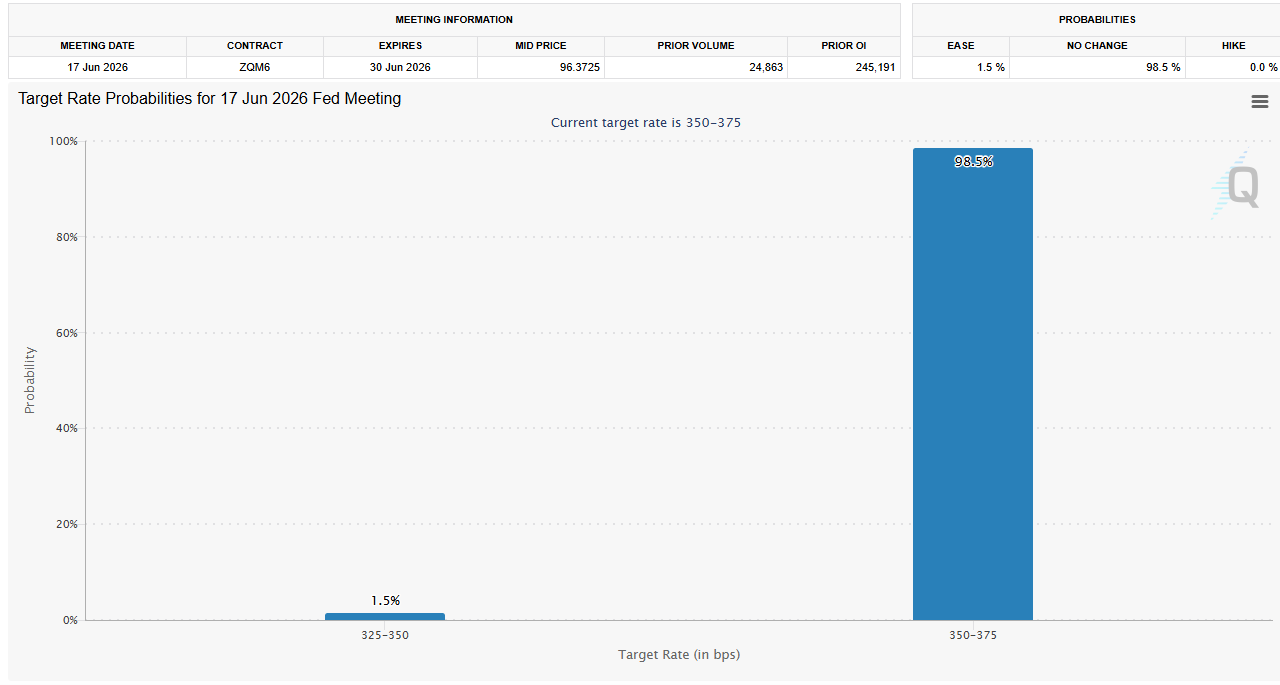
Image Source: CME FedWatchTool
Bond Market Update
As for the impact on treasury markets, bond yields have soared after the latest release. 2-year yield rose above 4%, whereas 10-year yield climbed to the highest level in ten months at 4.48%.
Dollar Index Technical Analysis (DXY)
The USD Index is currently sitting at 98.60 as a support for the safe haven amid an inflation surprise and rising tensions in the Middle East.
- Structural Ceiling: It goes without saying that the 2026 high at 99.18 (achieved back in April 8 on the failed ceasefire attempt) serves as the structural ceiling.
- Structural Floor: 97.60-97.80 stands as the established floor in this case. A breakdown below 97.60 on the confirmed close would lead to a retest of 97.00 followed by Cambridge 90-96 year-end target.
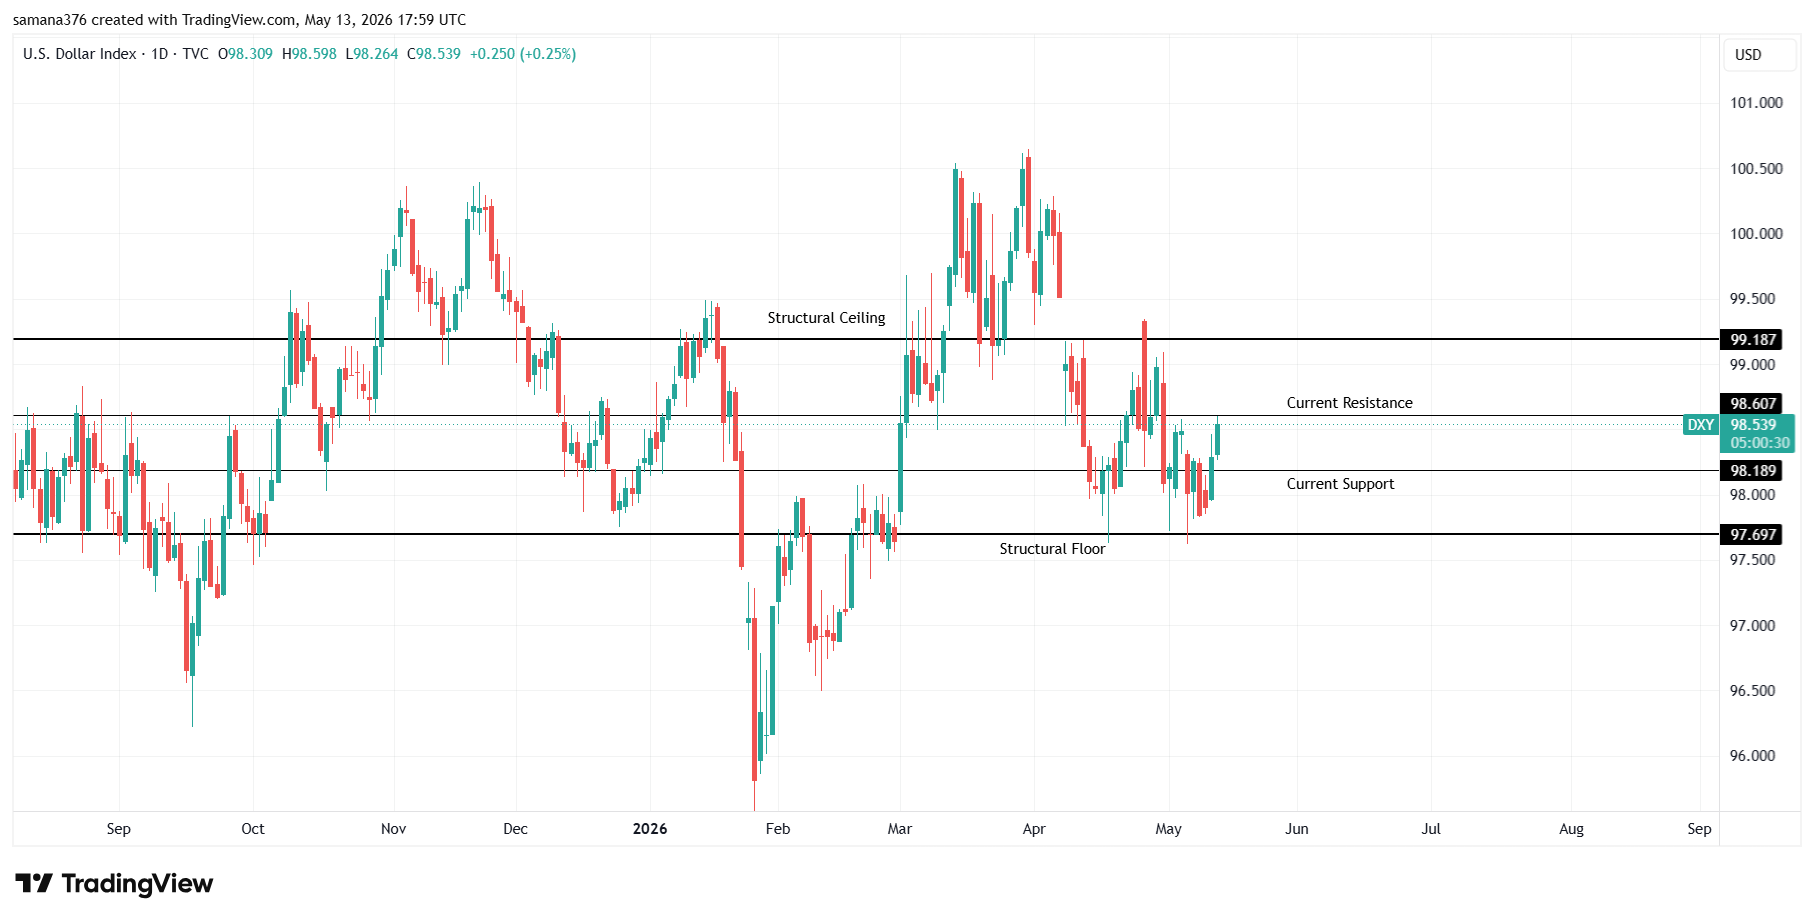
Image Source: Trading View
At the moment, the dollar is being pulled towards 98.60 due to the CPI/PPI surprises and growing pessimism about the possibility to achieve peace in Iran. Once the reflationary effects are exhausted, the structural factors of dollar bearishness would return – including fiscal expansion, Fed hawkishness constrained by a supply shock, and a war that increases both oil prices and weakens consumer demand. The bias above 98.20 remains negative in my view until the dollar closes above 98.60 on the daily timeframe.
How the Dollar Drives Other Financial Markets
Once you understand the situation around the USD Index, the outlook of best assets during inflation and war becomes obvious:
- Crude Oil: It is hovering around $101 per barrel (WTI) and $103.8 per barrel (Brent). Peace agreement between Washington and Tehran would be bullish for oil and bearish for the dollar. As the IEA warns, global oil reserves "are rapidly shrinking," which should create a near-term floor for Brent. To track US-Iran war effect on oil prices, be on the watch for the test of $100 level, which would indicate that peace negotiations are moving ahead.
- Gold: After the inflation data was released, gold suffered a sharp sell-off with a test of the support near $4,600. Why is gold falling if inflation is rising?Well, gold is mostly priced by real yields. When inflation rises, and Federal Reserve prepares for more rate hikes, real yields become extremely attractive. Gold waits for the Fed to blink.
- Silver: Opened at $86.36, it went as high as $88.3 by mid-day (2.23% daily gain). The silver price rally has continued for seven days in a row (from $72 to $88.3 in just seven trading days). But silver is the precious metal that reacts quickly to any dovish signals from Washington or Beijing, because at the moment, the gold/silver ratio stands at 53:1.
- EUR/USD: The euro-dollar pair is hovering near 1.1710 as the dollar strengthens against it. EUR/USD is a direct beneficiary of the peace talks. By H2 2026, according to Cambridge's forecasts, the pair is expected to reach 1.18-1.23, but this will only happen once the Strait of Hormuz opens again.
- US Stocks: Yesterday, NASDAQ fell 0.87%, and the S&P 500 dropped 0.67% amid stock market inflation fears. S&P 500 futures struggle to recover from a loss caused by 1.4% MoM PPI print. Defensives outperformed, semiconductors underperformed.
What’s Next?
The Trump-Xi summit will take place in Beijing today through Friday. Iran issue will be discussed during the talks, although Trump himself says that the main topic will be trade relations. The market expects a clear sign that Beijing favors peace talks – a general statement that the conversations were productive would have little impact, while a promise to address the issue in more detail would be a game changer.
- Today's 6.0% print has killed the chance of rate cuts for good. If the dollar cannot break 99.18, it would mean that the bull run has finished.
- The Handover: Janet Yellen will hand the keys to the new Fed Chair, Jerome Warsh, on Friday. His first public appearance in that role will attract attention of each and every fixed income trader in the world.
The dollar isn't going anywhere anytime soon – and it's waiting for the hawkish chair to give some reactions to 6.0% inflation rate. There is nothing much that can be done right now but knowing the levels and triggers.
Written by: Saman Ali
Disclaimer:
This article is for informational and educational purposes only and does not constitute financial, investment, trading, or legal advice. Always do your own research or consult a licensed advisor before making trading decisions.
Technical Analysis in Trading: The Map, The Trap, and The Edge

Technical Analysis in Trading: The Map, The Trap, and The Edge
Technical analysis is the most widely used methodology in speculative markets, and ironically, the most widely misunderstood. Traders deploy TA across forex, CFDs, cryptocurrencies, stocks, shares, commodities, and indices believing they are gaining foresight into future price. What they are often gaining instead is pattern recognition bias dressed as analysis, and that bias is the single fastest route to capital destruction. Unlike investing, trading operates in leveraged environments, tight invalidation windows, and rapidly shifting market regimes — meaning TA was never designed to tell you what will happen, but to tell you what is happening, and more importantly, what must not happen for your idea to remain valid. The trader who confuses interpretation with prediction eventually loses everything, not because TA doesn’t work, but because they used it for a purpose it was never meant to serve.
The Anatomy of the Technical Illusion
Retail traders approach charts like historians searching for repetition. They believe if price bounced off a level before, that level now carries an invisible force field into the future. This creates the illusion of control and certainty. The market occasionally rewards this thinking, not because the analysis was correct, but because price simply revisited a liquidity pool that happened to align with a drawn level. The danger lies in the other 90% of the time, when price doesn’t respect those levels at all — it weaponizes them. Markets are engineered around liquidity consumption. Support and resistance are often not barriers, but magnets, used by institutions to trigger stop-loss waterfalls, fill large orders, and reverse price only after retail capital has been harvested. The chart looks predictable in hindsight, but unpredictable in execution, which is exactly how the trap is constructed.
Examples of Static TA Thinking That Would Destroy Traders

1. “Historical Support Always Holds” – The Nasdaq Fallacy
Consider the Nasdaq 100 index — a favorite CFD instrument for global traders. If a trader in 2010 had studied the previous decade of price action, they would have found a clean market structure of swing lows repeatedly defending the 1800–2200 zone. A static-thinking technician would conclude that future pullbacks into this region must present long opportunities. Fast forward to 2020, when the index collapsed from 9700 to 6600 in under one month — ripping through 10 years of historic support. Traders who bought because “support always held in the past” would have endured a 30% loss in weeks on leveraged margin. Many would double down at 7200, believing in mean reversion, only to face further liquidation sweeps before price recovered. Then again in 2022, Nasdaq fell from 16,500 to 10,500, a 36% drop, once more ignoring long-term structure entirely. A trader using high CFD leverage without invalidation logic wouldn’t lose 30% or 50% — they would lose 100%, repeatedly re-entering the same collapsing zones until margin failure. The mistake wasn’t technical analysis — the mistake was believing that TA predicted the future instead of describing the present. TA should have told them: “If price closes below 6600, the long idea is invalid — regardless of history.” But history blinded them, and the market punished them for it.
2. “Resistance = Reversal” – The XAU/USD Trap
Gold (XAU/USD) has been in a powerful macro uptrend over the past 2+ years, making it one of the most attractive CFD instruments for breakout and carry-flow traders. Between 2023 and 2025, price formed extremely visible resistance zones at 1930, 1985, 2050, 2075, 2145, and 2200. Retail traders treated each as a reversal fortress. Every indicator screamed overbought. RSI sat above 70 for weeks at a time. MACD was extended. Commentators called for correction after correction. What actually happened? Gold blew through each resistance zone, sometimes retraced briefly, and then continued trending 400–1200+ pips higher. Traders who sold at resistance without regime awareness experienced a phenomenon that destroys most technicians:
-
Overbought stayed overbought
-
Resistance became support after liquidity sweeps
-
Stop losses were triggered above highs before real reversals
-
Trend continuation made static levels irrelevant
In leveraged CFDs, this behavior would repeatedly liquidate traders selling resistance, even though the analysis looked logical. The market didn’t reverse because resistance was broken — it reversed after liquidity was consumed beyond resistance, once institutions were filled. The professor’s rule applies: “A level is only valid until price behavior invalidates the thesis.” Not a second longer.
3. The “Carry Pair = Safe Support” Catastrophe
Let’s take carry trading favorites like USD/TRY or USD/ZAR, often traded via CFD platforms for swap or trend exploitation. A trader may analyze USD/TRY from 2018 to 2020 and observe repeated price stabilization around 5.80–6.20. Support looks impenetrable. But by 2023 the pair traded above 25.00 — a 300%+ currency devaluation, completely disregarding previous structure. Even if swap was positive, any leveraged trader holding longs at historic support without invalidation rules would be obliterated, because the market shifted regime entirely when inflation dynamics, central bank credibility, and macro volatility altered capital flows. Technical analysis should have told them to adjust SL and trend bias using volatility measures like ATR or momentum filters like ADX, but static level reliance would have wiped them out long before swap accumulation mattered.
4. “Chart Patterns Always Play Out” – The Bitcoin Graveyard
Crypto markets are TA-heavy ecosystems, meaning the trap density is even higher. Between 2021 and 2024, Bitcoin formed dozens of textbook patterns:
-
Double tops at 69,000
-
Head & Shoulders breakdowns
-
Bull flags
-
Falling wedges
-
Ascending triangles
Retail traders treated each as a future guarantee. What did the market do instead? It delivered fakeouts in both directions, sweeping lows to 15,500 in 2022 (-77%), then rallying back to 73,000 in 2024, trapping shorts and longs symmetrically. Traders who believed chart patterns guaranteed price direction were wiped out not by market movement, but by market sequencing — liquidity sweeps first, narrative logic last. The lesson here for all markets is that TA must evolve into a rules-based framework:
“If the pattern fails, the trade fails. If the market regime changes, the strategy changes. If liquidity is taken, wait for confirmation, not nostalgia.”
TA Best Practices That Keep Traders Alive

1. Think in Scenarios, Not Forecasts
Professional traders never conclude with “price will go here.” They conclude with:
-
“If price breaks and closes above this range → continuation likely.”
-
“If price rejects after liquidity sweep → reversal scenario active.”
-
“If volatility expands beyond threshold → reduce size or widen risk logic.”
This keeps ego out of execution and capital alive long enough for probability to matter.
2. Invalidation Is More Important Than Confirmation
Most traders look for confirmation. Professionals look for invalidation first. A good rule:
-
A trend trade is dead when structure breaks against position and holds
-
A range trade is dead when expansion invalidates mean-reversion logic
-
A pattern trade is dead when the pattern fails before RR plays out
TA should protect capital before it attempts to grow it.
3. Use Indicators as Behavioral Filters, Not Directional Oracles
The following indicators are statistically useful when applied correctly:
Trend Identification
-
20/50/200 Moving Averages → directional bias and regime structure
-
ADX → trend strength vs range regime
-
Above 25 = trend confirmation
-
Below 20 = avoid trend strategies
-
Momentum Awareness
-
RSI → only reliable for reversals when market is not trending
-
MACD Histogram → momentum contraction/expansion behavior
Volatility and Risk Distance
-
ATR → SL/TP distance based on true volatility
-
Bollinger Band Squeeze → breakout loading detection, not breakout direction
Volume (Critical for Crypto, Shares, Indices, CFDs)
-
Volume Profile → institutional value zones
-
VWAP → fair-value pricing bias
-
Relative Volume spikes → participation detection
A clean chart with 2–3 behavioral filters outperforms a noisy chart with 10 indicators every time.
TA Conclusion Every Trader Must Internalize
Technical analysis is essential in every speculative market because it reveals participation, structure, momentum, and liquidity faster than any fundamental headline ever will. But the moment a trader believes TA gives them future knowledge, they detach from reality and attach to bias — and the market always punishes that transition. Nasdaq would have destroyed anyone relying on 20-year support lines. Gold would have destroyed anyone selling every resistance tap for 2 years. Bitcoin would have liquidated anyone trusting every textbook pattern without invalidation logic. TA is not the art of being right — it is the art of structuring decisions, defining risk, reading behavior, and executing with discipline in uncertainty.
The future of price is unknown. The risk on your trade should never be. That is the edge.
Disclaimer:
This article is for informational and educational purposes only and does not constitute financial, investment, trading, or legal advice. Always do your own research or consult a licensed advisor before making trading decisions.
Our #1 Trusted Partner - TiBiGLOBE

Tech Giants in Motion: Key Updates from Amazon, Google, and Apple

Tech Giants in Motion: Key Updates from Amazon, Google, and Apple
The most advanced technological firms in the world are shaping the future of e-commerce, cloud computing, and consumer devices. This article provides a summary of Amazon, Google, and Apple including their recent developments, financial results, short-term actions, and long-term strategies.
Amazon: Aggressive AI and Logistics Expansion Amid Restructuring
Amazon began as a small online bookstore that was started by Jeff Bezos, however, it is currently one of the leading companies in the e-commerce sector and cloud computing. It shows that the company is capable of continuing to expand and evolve despite the uncertain economy. Main segments such as Amazon Web Services (AWS) have also produced consistent performance, and newer segments, such as advertising continue to develop at an accelerated rate.
Latest Updates:
Amazon reported its net sales as 180.2B in Q3 2025 that is approximately 13% more than in the previous year. AWS contributed to the majority of this growth, as revenue increased by 20 per cent which shows that it is the backbone of the business. Operating income remained constant at 17.4B, indicating consistent earnings, yet cash flow was reduced since the company incurred high expenses on property, equipment, and AI systems as part of short-term expansion strategies. CEO Andy Jassy stated that AI is involved in all areas now, including logistics and delivery, cloud computing, and online shopping.
Amazon has also increased its data center capacity by 3.8 gigawatts in the last year to support more complicated workloads. Meanwhile, same-day delivery is becoming faster and more convenient in rural locations. Prime Air drones are also being equipped to make deliveries within less than 60 minutes in Italy and the UK. As it continues to expand in those regions, Amazon intends to lay off approximately 30,000 corporate employees or approximately 10% of its office workers. It emphasizes that the company is making an attempt to reduce expenses and make operations easier.
Short Term Plans:
Presuming to the Q4 2025, Amazon anticipates net sales to range between 206B - 213B. It shows that the company has no doubts regarding the demand during holidays. It is projected to generate operating income ranging between 21 and 26B. Against the season, Amazon plans to employ 250,000 seasonal employees and increase its same-day delivery further. AI projects are ongoing, and Trainium 2 chips are being deployed and foundation models improved using Amazon Bedrock. The company is also staying on top of the challenges as it is speeding up inventory imports to deal with tariffs. Amazon Bazaar also enters new markets and plans early Black Friday promotions. It emphasizes that the company is prepared to face the busiest shopping season in the year.

Long Term Plans:
Over the long term, Amazon intends to end up automating a significant portion of its processes, potentially eliminating more than 500,000 jobs and saving an estimated 12.6B. Leadership in AWS and AI is also a priority, with more sophisticated models such as Claude by Anthropic. Another important area of focus is expansion of delivery of perishable goods. It shows that Amazon desires to deliver customers in the best way possible despite the kind of products. Project Kuiper is also proceeding, so this shows that the company is looking at launching satellite broadband into those areas which require it the most.
On sustainability, Amazon intends to be fully powered by renewable energy by 2025 and achieve carbon neutrality by 2040. It points out that the firm takes long-term environmental targets seriously. Analysts forecast that Amazon can increase at an annual rate of approximately 11% as far as 2030. It shows that the company is likely to continue increasing its revenue, and the share price would exceed $1,000 by 2040.
|
Category |
Key Highlights |
|
Latest Developments |
- Q3 2025 net sales: $180.2 B (+13% YoY) - AWS growth: +20% - Added 3.8 GW of data-center capacity - Preparing to cut 30,000 corporate jobs (~10% of office workforce) - Expanding same-day delivery, especially for perishable groceries - Prime Air drone rollout planned in Italy and UK |
|
Financials / Guidance |
- Operating income (Q3): $17.4 B - Free cash flow declined due to heavy capex - Q4 2025 net sales guidance: $206–213 B - Q4 operating income guided to $21–26 B |
|
Short-Term Plans (Next ~6– 12 Months) |
- Hire 250,000 seasonal workers for holiday period - Expand grocery same-day delivery in more locations (urban + rural) - Scale up Prime Air deliveries internationally - Invest $100 B+ in AWS / AI infrastructure (Trainium 2, Bedrock foundation models) - Accelerate inventory import to mitigate tariffs - Increase low-cost item offerings via Amazon Bazaar in new markets - Preview and execute aggressive Black Friday deals |
|
Long-Term Strategy (2026+) |
- Use robotics / automation to replace ~500,000 roles and optimize operations - Deepen AWS & AI integration: train and deploy foundation models, expand custom silicon - Expand ultra-fast delivery network for perishable goods |
|
-Build out Project Kuiper satellite broadband for global coverage -Achieve 100% renewable energy by 2025 and carbon neutrality by 2040 -Target sustained ~11% annual revenue growth through 2030; potential stock > $1,000 by 2040 |
Google (Alphabet): Infrastructure and AI Expansion
Alphabet is best known for creating Google Search, which is the world’s most widely used search engine. Additionally, it controls over 90% of the market, and advertising across Google’s platforms has helped Alphabet’s earnings grow over time. Advertising still brings in most of the company’s revenue, while recent improvements in AI have helped Google Cloud grow quickly.
Latest Updates:
Google is also increasing its investment in technology and cloud systems. The company announced a $40B investment in Texas, where it will build three new data centers in Armstrong and Haskell counties. It will also expand centers in Midlothian and Dallas. These sites will handle growing digital demand, increase cloud capacity, and improve energy efficiency.
On the research side, Google is developing new systems that improve ad recommendations and auction scoring. Meanwhile, the company is strengthening its advertising business while also expanding its technology and cloud operations.
Short Term Plans:
In the short term, Google will bring its new Texas data centers online to support advanced digital models. The company is also expanding Google Cloud for business customers and adding new features to tools like Gemini Business add-ons, Forms, and Google Voice.
Additionally, AI Mode is getting upgrades to help with booking tasks and productivity. Cybersecurity, passwordless Gmail, and fraud protection are top priorities. Google is also investing in regional training programs to build more engineering talent. Analysts expect about 11% revenue growth and around 19% earnings growth soon, with an average share target of $316.
Long Term Plans:
Over the long term, Google aims to stay a leading provider of advanced technology for large digital applications. The company will continue building energy-efficient and sustainable data centers to cut long-term costs. Google Cloud will compete directly with AWS and Azure.
Moreover, Google is investing in quantum computing, ambient computing, and autonomous systems like Waymo, Maps, and the Gemini platforms. Analysts expect the stock to reach between
$924 and $950 by 2030, and possibly rise to $2,322 by 2035.

|
Category |
Key Highlights |
|
Latest Developments |
- $40 B investment in Texas for new data centers (Armstrong, Haskell) and expansion in Midlothian / Dallas - Research in ML infrastructure: optimized embedding, RPC coalescing, better error handling - Emphasis on energy-efficient operations and job creation via data-center build-out - Strengthening Google Cloud with AI-first infrastructure |
|
Financials / Guidance |
- Strong cloud growth (AI + enterprise workloads) - Raised capex to fuel infrastructure-scale AI demand - Analysts project ~11% revenue growth in near-term - Expected EPS growth ~19%, average share target around $316 |
|
Short-Term Plans (Next~6–12 Months) |
- Build and operationalize Texas data centers to support foundation models and generative AI - Expand Google Cloud offerings for enterprise AI workloads - Roll out AI features in Workspace (Forms, Voice, Gemini) - Improve security, adopt passwordless Gmail, and increase fraud protection - Develop regional technical training programs for engineers and energy workers - Enhance on-device and cloud AI capabilities (AI Mode, agentic features) |
|
Long-Term Strategy (2026+) |
- Become a global backbone for AI workloads (training + inference) - Scale energy-efficient and sustainable data centers - Compete aggressively in cloud with AWS and Azure - Invest in quantum computing, ambient computing, and autonomous systems (Waymo, Maps, Gemini) - Build strong engineering talent pipelines via training/education - Financial outlook: potential stock price $924–950 by 2030, possible rise to $2,300+ by 2035 |
Apple: Balanced Innovation and Domestic Expansion
Apple, on the other hand, continues using a measured approach that balances hardware innovation, AI integration, and a renewed push for U.S-based manufacturing.
Latest Updates:
- Recently, the company launched the iPhone Pocket in partnership with Issey This accessory comes in two versions: a crossbody model priced at $230 and a short-strap model priced at $150.
- Additionally, Apple announced a $600B U.S. investment plan over four years. This includes an AI server factory in Houston, Texas, which will create 20,000 jobs in areas such as R&D and silicon engineering.
- The company also invested $2.5B in Corning’s Kentucky plant to triple its production of cover glass used in iPhones and Apple Watches. Product innovation continues to drive Apple’s strategy.
- The iPhone 17 lineup has arrived, including the ultra-thin iPhone However, production has been reduced due to lower demand outside China. Apple also released AirPods Pro 3, featuring live translation, improved noise cancellation, and heart-rate monitoring.
- Moreover, the Apple Watch Series 11 has been introduced with a blood-pressure sensor that is still awaiting FDA approval.
- Software and services have also been upgraded with AI-powered features across Apple Maps, Wallet, Pay, Fitness+, and News+, offering highly personalized user experiences. Apple’s silicon roadmap continues to advance with the M5 chip, built on a 3nm process, powering the newest Vision Pro, iPad Pro, and MacBook Air/Pro devices.
- The company has also unveiled a new UI design language called Liquid Glass, which offers a smooth, glass-like visual experience across iOS and macOS. Meanwhile, Apple has delayed the Vision Pro N100 mixed-reality device to focus on AI-powered wearable smart
Short Term Plans:
In the short term, Apple is considering a major redesign of the iPhone, according to Bloomberg’s Mark Gurman. Following the release of the iPhone Air and the updated iPhone 17 Pro in September, the company is reportedly planning three entirely new models over the next three years. The rumored timeline suggests a foldable iPhone in fall 2026, followed by curved glass and an under-display camera in 2027.
Additionally, Apple will continue rolling out AirPods Pro 3 and Apple Watch Series 11. It will expand U.S. manufacturing while integrating AI-powered features across its ecosystem. The company will also focus on optimizing holiday retail strategies and improving software services.
Long Term Plans:
Over the long term, Apple plans to lead in AI-driven personal devices and wearable AR technology. It also intends to expand the integration of its M-series chips while scaling domestic semiconductor manufacturing and R&D. Furthermore, Apple expects to grow its services business by around 30%, contributing to a projected $4 trillion market capitalization.

|
Category |
Key Highlights |
|
Latest Developments |
- Launched iPhone Pocket with Japanese fashion brand Issey Miyake - Announced $600 B U.S. investment over 4 years, including a Houston AI server factory (20,000 jobs) - Invested $2.5 B in Corning’s Kentucky plant to triple glass production capacity - New hardware: iPhone 17, “iPhone Air” (titanium), AirPods Pro 3, Apple Watch Series 11 - Services updates: AI-powered Maps, Wallet, Pay, Fitness +,and News+ |
|
- Introduced the M5 chip (3 nm) and new UI “Liquid Glass” - Delayed Vision Pro N100 to focus on AI-centric smart glasses |
|
|
Financials / Guidance |
- Strong expected holiday quarter revenue (~$140B) - Long-term commitment to U.S. manufacturing and R&D - Services business continues to grow, contributing significantly to profitability |
|
Short-Term Plans (Next ~6– 12 Months) |
- Launch and scale iPhone 17 globally - Ship and promote AirPods Pro 3 and Apple Watch Series 11 - Expand U.S. manufacturing (Corning plant + AI server factory) - Integrate Apple Intelligence features into core apps (Maps, Wallet, Fitness+, News+) - Use M5 chip in newer devices (iPad Pro, MacBook, Vision Pro) - Deploy “Liquid Glass” UI enhancements and smart glass prototypes |
|
Long-Term Strategy (2026+) |
- Lead in AI-first consumer hardware: smart glasses, wearables, AR - Expand M-series silicon across Apple’s device lineup - Fully scale U.S.-based advanced manufacturing and AI infrastructure - Continue aggressive services growth (~30% CAGR) - Leverage on-device AI (Apple Intelligence) for better privacy and performance - Target long-term market cap growth toward $4T via hardware + services integration |
Disclaimer:
This article is for informational and educational purposes only and does not constitute financial, investment, trading, or legal advice. Always do your own research or consult a licensed advisor before making trading decisions.
Alphabet Inc. (GOOG) Q1 2025 Earnings Preview: What Traders Need to Know

Alphabet Inc. (GOOG) Q1 2025 Earnings Preview: What Traders Need to Know
Company Overview
Alphabet Inc., the parent company of Google, is far more than just a search engine giant. It is the nerve center of digital advertising, cloud computing, artificial intelligence, and the Android ecosystem. With revenue streams sprawling across YouTube, Google Cloud, Pixel hardware, and its sprawling ad network, Alphabet plays a vital role in shaping global tech infrastructure. Any shift in its earnings performance has rippling consequences, not only across the Nasdaq and S&P 500 but also across global sentiment in risk-sensitive currencies like the AUD, CAD, and emerging market FX.
Q1 2025 Earnings Snapshot
Alphabet is slated to report its Q1 2025 earnings on April 24, 2025, after the closing bell. Market expectations are building around a revenue print of approximately $89.2 billion — an 11% year-over-year increase. The boost comes largely from continued momentum in cloud computing and AI integration, particularly through Google Cloud and the Gemini language model.
Earnings per share (EPS) is forecast at $2.01, compared to $1.89 in Q1 2024. While a nearly 6% year-over-year EPS increase might not sound dramatic, it represents Alphabet’s ability to weather macroeconomic headwinds and regulatory scrutiny while still delivering consistent growth. That’s notable in a year where tech giants are facing both innovation bottlenecks and tightening ad budgets.
Google Cloud is expected to remain a standout, with anticipated revenue exceeding $12.3 billion. This signals year-over-year growth between 27% and 30% — a powerful affirmation that Alphabet is successfully carving out enterprise clients in a space long dominated by AWS and Microsoft Azure.
Challenges and Considerations
Despite promising growth figures, Alphabet isn’t without its headwinds. Regulatory pressure remains front and center. A U.S. District Court has ruled that Alphabet illegally maintained monopolies over online advertising technologies, which could result in a forced structural breakup of its ad tech stack. This would be monumental. While such changes are likely years away, the sentiment implications for investors are immediate.
Alphabet’s stock has fallen over 20% year-to-date, making it one of the weaker performers among the Big Tech cohort. This underperformance reflects investor concerns about slowing ad revenue growth and the company's dependence on advertising at a time when the global economy is tiptoeing around recessionary fears.
Additionally, broader macroeconomic pressures — including sticky inflation, rising bond yields, and geopolitical tensions — have kept investors cautious. As traders, we must also consider the potential impact of rising tariffs or tech decoupling between the U.S. and China, which could dent international revenue streams and cloud expansion.
Analyst Expectations
Wall Street analysts have issued a wide range of price targets for Alphabet's stock over the next three months. On the low end, some bearish forecasts expect shares to retrace toward $115, particularly if earnings or forward guidance disappoint and regulatory headlines worsen. Mid-range estimates suggest a neutral path, targeting $135–$140 per share, contingent on solid performance but moderate growth. The more optimistic projections — assuming strong AI monetization and cloud growth — place Alphabet’s fair value closer to $155, which would represent a breakout to new 52-week highs.
Trading Insights
For forex and CFD traders, Alphabet's earnings carry broader implications than one might think. Strong earnings typically contribute to a positive sentiment around the U.S. economy, which can drive risk-on behavior. This means the dollar may strengthen versus haven currencies like the JPY or CHF, while high-beta currencies like AUD and NZD may rally.
However, if Alphabet disappoints — especially on forward guidance — the risk-off mood could swiftly return. Equities may sell off, U.S. yields could dip, and traders might rotate into safer assets. Watching how tech stocks respond in after-hours trading can give early clues to sentiment direction going into the next trading session.
Also worth tracking is the tech-heavy Nasdaq’s reaction post-earnings. Since Alphabet holds significant weight, a rally or crash in its stock can influence overall index flows, which in turn affects ETF demand and currency pairs tied to risk sentiment.
What Traders Should Watch
In terms of specific trader focus, there are several elements that matter most:
-
Google Cloud: Continued market share gains here reinforce USD strength narrative, as Alphabet drives tech sector confidence.
-
AI Monetization: Updates on the rollout of Gemini across services will be key. If monetization appears robust, traders may rotate back into risk-on trades.
-
Regulatory Language: Even a passing mention of asset divestitures or changes to Alphabet’s ad model could create temporary volatility across tech and consumer sentiment plays.
-
Earnings Call Tone: A confident, forward-leaning tone from Alphabet’s leadership could reinforce risk appetite and USD flows, whereas defensive language may do the opposite.

Conclusion
Alphabet’s Q1 2025 earnings aren't just another quarterly update — they’re a pulse check on the U.S. tech economy and a directional cue for broader risk sentiment. From a trader’s perspective, this report will either confirm the resilience of Big Tech or highlight cracks that could trigger rebalancing across sectors and asset classes.
Traders should remain alert not just to the headline numbers, but to the narrative — the subtleties in the call, the posture of guidance, and how the broader market responds. Alphabet might not set forex charts on fire by itself, but it can ignite or extinguish the flames of global risk sentiment.
Disclaimer:
This article is for informational and educational purposes only and does not constitute financial, investment, trading, or legal advice. Always do your own research or consult a licensed advisor before making trading decisions.
Navigating the Upcoming Earnings Season: Tech Sector Insights Amid Trade Tensions

Navigating the Upcoming Earnings Season: Tech Sector Insights Amid Trade Tensions
As the Q2 2025 earnings season approaches, investors and analysts are closely monitoring the technology sector, a pivotal component of the U.S. economy. Recent escalations in trade tensions, particularly the implementation of new tariffs by the U.S. administration, have introduced significant volatility and uncertainty into the markets. This article delves into the potential impacts on tech companies and the broader indices—S&P 500, Dow Jones Industrial Average (DJIA), and Nasdaq Composite—drawing insights from historical data and previous trade conflicts.
Current Market Landscape
In early April 2025, the U.S. administration announced sweeping tariffs, including a 34% rate on Chinese imports. China responded with similar measures, intensifying fears of a full-scale trade war. The immediate market reaction was stark:markets.businessinsider.com
-
S&P 500: Experienced a decline of over 1%, extending the previous week's losses.Reuters+1https://www.wdbj7.com+1
-
Dow Jones Industrial Average: Dropped 0.9% (approximately 349 points) on April 7, 2025.Yahoo Finance+2WSJ+2https://www.wdbj7.com+2
-
Nasdaq Composite: Showed resilience with a modest gain of 0.1%, despite broader market downturns.
This turbulence has erased trillions in market value globally, with tech giants like Meta, Microsoft, Google, and Amazon facing downward revisions in their earnings forecasts. markets.businessinsider.com
Tech Sector: Anticipated Challenges and Strategic Adjustments

The technology sector, heavily reliant on global supply chains and international markets, is particularly vulnerable to trade disruptions. Key concerns include:
-
Supply Chain Disruptions: Tariffs on Chinese imports could increase production costs for hardware manufacturers and semiconductor companies.
-
Reduced Advertising Revenues: Companies like Meta and Google may see declines in advertising from Chinese businesses due to retaliatory tariffs.markets.businessinsider.com
-
Earnings Forecast Revisions: Analysts from Jefferies suggest that tech firms might use the current environment as an opportunity to reset performance goals to more conservative levels, potentially improving long-term investor sentiment. markets.businessinsider.com
Historical Context: Trade Wars and Market Performance
Examining past trade conflicts provides valuable insights into potential market behaviors:
-
2018–2019 U.S.-China Trade War: The imposition of tariffs led to increased market volatility, with the S&P 500 experiencing multiple corrections. Tech companies faced significant earnings pressures due to disrupted supply chains and increased costs.
-
1980s U.S.-Japan Trade Tensions: Similar disputes resulted in market fluctuations and prompted companies to diversify supply chains, leading to long-term strategic shifts in operations.

These historical episodes underscore the market's sensitivity to trade policies and the importance of strategic adaptability among corporations.
Potential Impacts on Major Indices
The current trade tensions are likely to have varying effects on major U.S. indices:
-
S&P 500: Given its broad composition, the index may experience heightened volatility, especially if multiple sectors face tariff-related pressures.
-
Dow Jones Industrial Average: With its concentration of multinational corporations, the DJIA could be significantly impacted by international trade dynamics and currency fluctuations.
-
Nasdaq Composite: As a tech-heavy index, the Nasdaq's performance will closely mirror the tech sector's ability to navigate supply chain challenges and adjust to new market realities.
Strategies for Investors

In light of the upcoming earnings season and prevailing uncertainties, investors might consider the following approaches:
-
Diversification: Spreading investments across various sectors and asset classes can mitigate sector-specific risks.
-
Focus on Fundamentals: Prioritizing companies with strong balance sheets and minimal exposure to tariff impacts may offer more stability.
-
Stay Informed: Regularly monitoring policy developments and earnings reports will be crucial for timely decision-making.
Conclusion
The forthcoming earnings season is set against a backdrop of escalating trade tensions, posing challenges and opportunities for the tech sector and broader markets. Drawing from historical precedents, it is evident that while trade wars introduce short-term volatility, they also compel companies to innovate and adapt strategically. Investors should remain vigilant, informed, and flexible in their strategies to navigate this complex landscape effectively.
For more in-depth analyses and the latest market insights, stay tuned to AllFXBrokers.com.
Disclaimer:
This article is for informational and educational purposes only and does not constitute financial, investment, trading, or legal advice. Always do your own research or consult a licensed advisor before making trading decisions.


