

Displaying items by tag: inflation
Is Gold Losing its Safe Haven Status?

Is Gold Losing its Safe Haven Status?
Currently, gold is trading at $4,507 per ounce, 20% below the all-time high of $5,595 it hit just four months ago. A war is live in the Middle East. US-Iran ceasefire talks have stalled again. And the metal the entire world was trained to reach for in exactly this kind of moment simply isn't performing. If you're still running the "crisis = buy gold" playbook, the price chart is telling you something you need to hear.
So before jumping to conclusions, it’s important to understand what the price is actually reflecting right now.
What the Price Is Actually Telling You Right Now
On January 29, gold peaked at $5,595, a breathless run fuelled by speculative capital piling in alongside institutional buyers. Then on February 28, US and Israeli forces struck Iran. By any traditional measure, that was gold's moment. Instead, gold fell 14.5% through March, worse than the FTSE All-World (–9%), worse than the S&P 500 (–7.8%), worse than Treasuries (–3.6%). The supposed protector was the worst performer in the room.
And importantly, this divergence is where the real story begins.
Today, with ceasefire talks broken down again, gold remains pinned below $4,510. The structural trap was already explained in my previous analysis, which states that the elevated inflation expectations from surging oil have pushed yields higher, kept the USD firm, and prompted markets to price in a Fed hike in late 2026.
A non-yielding asset in a rising-rate environment doesn't catch bids, even during a war. That's not bad luck. That's a design flaw in how most investors use gold as a hedge.
In other words, the macro environment is no longer working in gold’s favour the way many still assume it does.
"Traders are still anchored to an outdated playbook. The COVID crisis drove markets for five years until 2025. Now, in 2026, the rest of the decade will be shaped by Energy. Those who fail to recognise that shift will be dangerously late."
— LARS HANSEN, HEAD OF RESEARCH, THE GOLD & SILVER CLUB (VIA FXSTREET, MARCH 2026)
Three Assets Are Stepping Into Gold's Role
Building on that shift, gold's failure isn't happening in isolation. While it fell, three assets were busy doing what gold was supposed to do — and investors paying attention rotated accordingly.
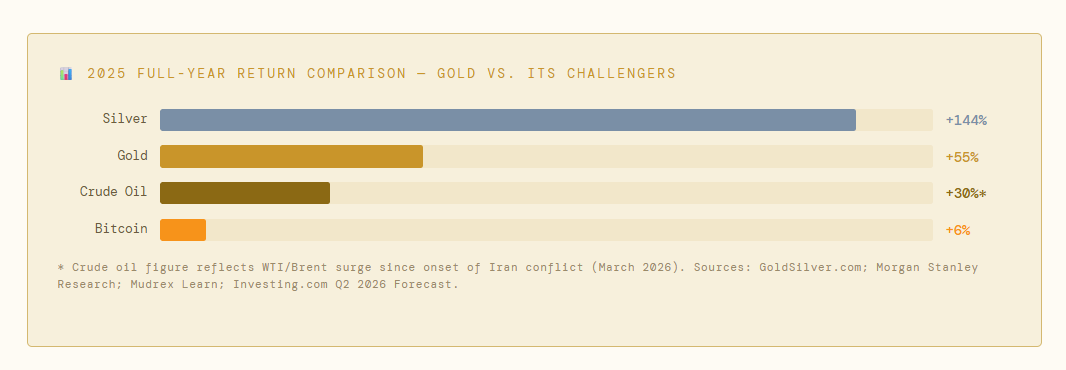
Taking this further, Silver is the most interesting play in the precious metal space. This 144% increase compared to gold's 55% gain has something that gold simply cannot match—double demand from monetary buyers and industrial end-users. EVs use 67–79% more silver per unit than combustion cars. Solar, AI data centres, 5G infrastructure — none of these slow down because markets get nervous. As the gold/silver ratio approaches the long run average of 60:1, the silver opportunity, while not the screaming buy it was at 104:1, is still significantly better than the opportunity that gold provides, which is dependent on fear.
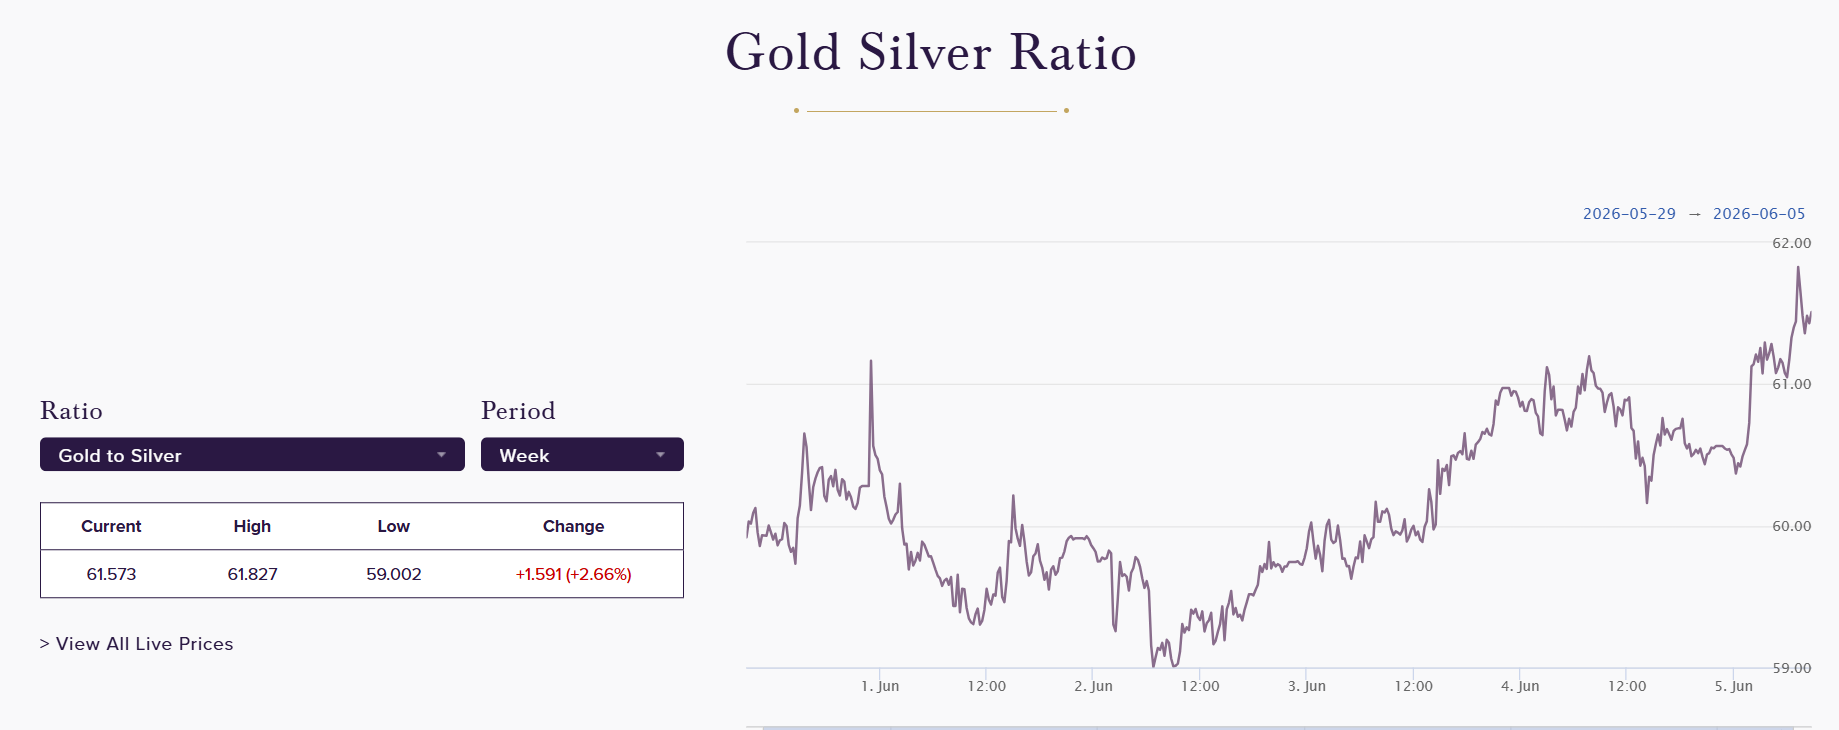
Image Source: https://www.chards.co.uk/gold-silver-ratio
This is where the divergence between fear-driven assets and utility-driven assets becomes clearer.
Crude oil did something revealing during the Iran conflict: it thrived on the same shock that crushed gold. Energy security retook the top spot as a geopolitical risk frame, and both WTI and Brent rose around 30% to $116 a barrel. Today, in a world where the Strait of Hormuz can be weaponized and investment upstream is structurally reduced, oil is starting to act as a store of geopolitical value, which it never was. For investors in areas where energy price fluctuations exist, not taking advantage of this rotation is a true portfolio risk.
So in contrast to gold, energy is now absorbing the very risk premium gold once dominated.
Bitcoinisn't taking the place of gold, it's competing with it for the same capital. According to JPMorgan, IBIT's inflows since 2024 are around twice as large as GLD's. When gold ETFs saw a $3 billion single-day outflow in March, the largest in two years,Bitcoin ETF inflows turned positive the same week. Fidelity Digital Assets explicitly pointed to this in their 2026 outlook, stating that the recent surge in gold is actually a “late phase of its leadership cycle” and that Bitcoin could be “ready to take the baton” from it. That's not fringe crypto commentary. That's a big institutional allocator indicating rotation.
And that rotation is already visible in the flows, not just narratives.
The Preference Shift Is Already Happening — Are You Positioned for It?
The flows agree with the price action. Gold ETFs attracted a record $19 billion in January 2026, which was due to institutional investors, not retail investors. Despite that record-breaking beginning, the March battle wrought havoc on leveraged positions, and YTD ETF holdings slipped below January 1 levels. Old school speculators, who used to follow the trends of SPACs and meme stocks, now went back to gold, and that sounds bullish until you understand that their main role is to add volatility rather than support. Retail investors are often last to see the flush when institutional and speculative layers unwind simultaneously.
And as a result, positioning has become more fragile than it appears on the surface.
The more significant change is in the conceptual domain. The tried-and-tested advice of "buy gold when things go wrong" is being replaced with more accurate terminology. In the words of a recentanalysis: “Gold is the solution to slow-blow, systemic risks—dollar debasement, sovereign debt trends, financial system distress.” Oil absorbs supply-chain ruptures. When policy loosens and inflation expectations rise, bitcoin gathers capital. Silver not only reflects monetary demand, but also industrial demand. Anyone who invests without determining what type of risk they are hedging and in what asset to hedge it is not diversified. They don't have enough time.
So the framework itself is shifting from a single-asset hedge to a multi-asset risk map.
Why the Counterargument — And Why It Doesn't Change Your Positioning
The bull case for gold deserves a hearing: central banks are still buying, the de-dollarisation thesis is intact, and both Morgan Stanley ($5,200) and J.P. Morgan ($6,300) have bullish year-end targets. That is all correct. But central banks are multi-decade strategic buyers — they're not managing your retirement account. The People's Bank of China added 160,000 troy ounces in March, gold's worst month in years. Sovereigns used the dip. This is a different investing strategy from an active trader who owns gold as a geopolitical hedge.
So while the narrative remains intact, the participant mix matters more than the headline targets.

The pattern that has been repeated is: gold does well during the banking stress/recession fear/dollar debasement periods of deflation. And, it struggles in inflationary geopolitical crises, energy shocks, supply chain ruptures, wartime inflation, precisely the environment we're navigating right now.
Therefore, knowing what kind of crisis you're hedging isn't a classroom exercise, it is what will make or break your hedge when you need it.
And this distinction is what separates accurate hedging from misplaced protection.
Gold Is Still Relevant. But It's Not Enough Anymore.
Gold has not lost its identity as a safe haven, but it has lost its claim to being the only safe haven. The Iran conflict was a live stress-test, and the hedge failed in exactly the scenario investors feared most. That changes how you should size and complement it.
Put simply, diversification of hedges now matters more than conviction in a single one.
If you're an all-gold portfolio and you don't have anything else as your defensive layer, you have a blind spot to the inflationary geopolitical shock. Include energy exposure (equities, energy ETFs or futures) to address the possibility of supply chain failures and a rise in energy prices. That is not a guess. It's the scenario that just played out.
If you are silver and underweight, then it is the most obvious area you need to fill. Silver has a bull case as well, thanks to the industrial demand floor brought by EVs, solar, and AI infrastructure, which is something that doesn't rely solely on fear that isn't found in gold.
On Bitcoin: institutional adoption through ETFs is structural, not cyclical. It doesn't have to be a "safe haven" to qualify as an institutionalizing asset that is becoming a non-sovereign store of value. Watch the inflow data, not the price narrative.
The question was never whether to own gold. It's whether gold alone is still an adequate answer. With the evidence in hand in 2026, it clearly isn’t.
Written by: Saman Ali
Disclaimer:
This article is for informational and educational purposes only and does not constitute financial, investment, trading, or legal advice. Always do your own research or consult a licensed advisor before making trading decisions.
How the Iran Conflict Is Impacting the Dollar, Gold, Oil, Stocks, and Treasury Markets

How the Iran Conflict Is Impacting the Dollar, Gold, Oil, Stocks, and Treasury Markets
In just five trading sessions, markets went from debating Fed cuts to preparing for possible rate hikes in 2027. Behind that shift: exploding war costs, a 6.0% PPI shock, and a dollar that refuses to weaken.
In this article, we discuss the impact of Middle East tensions on markets, how defense spending affects the economy, why the Fed may not cut rates in 2026, why the dollar is strengthening again, Key DXY levels to monitor, and why gold is falling despite inflation.
Pentagon Raised Warning of Increased War Costs
According to the Pentagon's testimony to Congress, the ongoing Operation Epic Fury has already cost American taxpayers $29 billion so far this year. In other words, the cost of the US-Iran conflict increased by $4 billion just in two weeks' time. Pentagon's acting comptroller Jay Hurst says that roughly $24 billion of those expenses were needed to repair and replace the equipment destroyed by the war. "But we have a lot of unknowns there," says Hurst, referring to expenses for repairs at US military bases damaged in the fighting.
How does the Iran war affect the US dollar? Fiscal impacts from such a large-scale conflict are not to be ignored, especially when the Department of Defense is now trying to push for an extra $1.5 trillion for US defense budget 2027. At the same time, Republican congressman and head of the House defense subcommittee Ken Calvert asked whether the operation would have a negative impact on US military readiness over the long term.
These concerns show the first signs of a hawkish shift in fiscal policy among fellow Republicans who stand alongside the White House. In other words, war spending will lead to widening budget deficits and a growing supply of US government bonds, causing further crowding out effects for private investment.
In addition to fiscal impacts, there is an even faster one that is likely to come through the channel of energy.
How Iran War is Impacting US Inflation and Fed Decisions?
April CPI came in at 3.8% y-o-y, which is the highest figure since May 2023 and above the consensus forecast of 3.7%. Meanwhile, the rise in energy costs was as high as 17.9% y-o-y, while gasoline prices increased by 28.4% y-o-y, and fuel oil prices by 54.3% y-o-y. What is especially concerning to investors: core CPI, excluding food and energy, jumped 0.4% m-o-m and 2.8% y-o-y, above expectations.
But that was nothing compared to today's print. The latest PPI reading stood at 6.0% y-o-y and crushed the consensus estimate of 4.9%. Month-over-month change in producer prices also skyrocketed, reaching 1.4% and almost three times exceeding the anticipated 0.5% increase. What does it mean? If producer prices continue to grow at such a fast pace, the inflationary pressure in the consumer sector remains intact as well. Excluding food, energy, and trade, core PPI increased by 0.6% m-o-m and 4.4% y-o-y. Read our latest analysis to learn more about oil war’s impact on food prices.
Now to answer the question; Will the Fed cut rates in 2026?It doesn't really require deep expertise in economics to realize that this data kills the whole idea of rate cuts in H2 2026. Bank of America recently moved its projections for the first rate cut to H2 2027. According to the CME Fed Watch index, currently, zero chances are seen for rate cuts in 2026, while 70+ percent probability stands for a rate hike in April 2027. In terms of interest rates, this represents an enormous re-pricing over just five trading sessions.
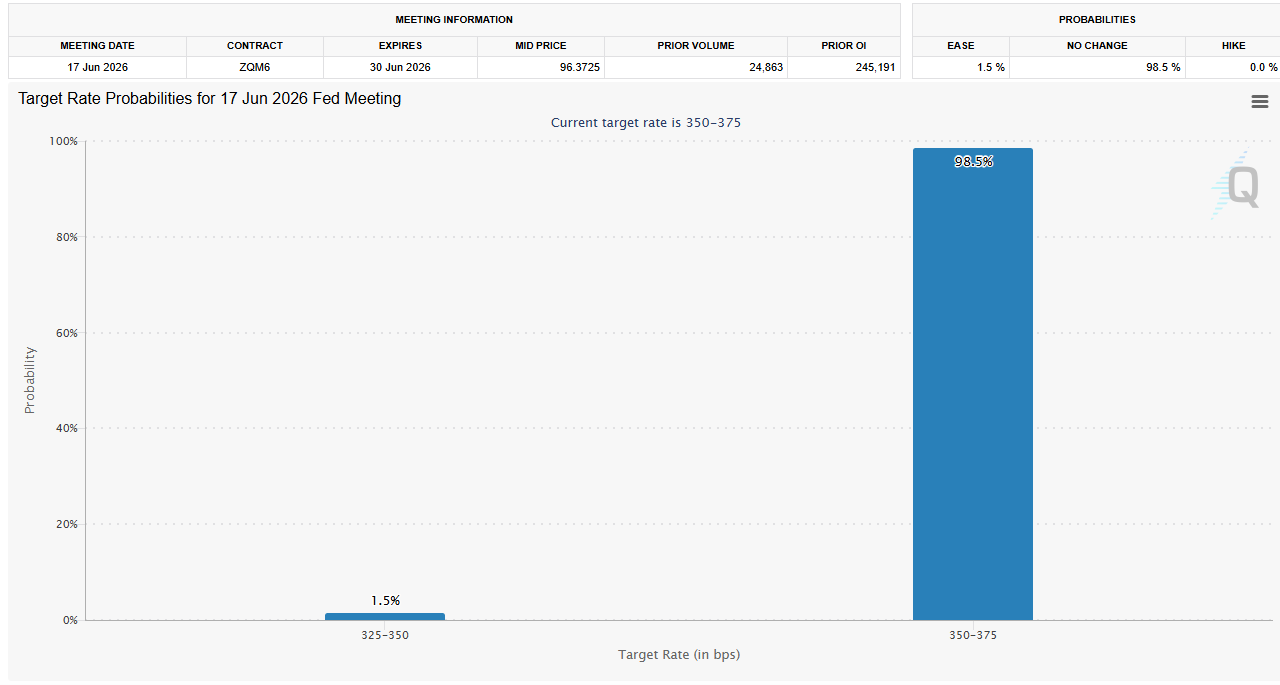
Image Source: CME FedWatchTool
Bond Market Update
As for the impact on treasury markets, bond yields have soared after the latest release. 2-year yield rose above 4%, whereas 10-year yield climbed to the highest level in ten months at 4.48%.
Dollar Index Technical Analysis (DXY)
The USD Index is currently sitting at 98.60 as a support for the safe haven amid an inflation surprise and rising tensions in the Middle East.
- Structural Ceiling: It goes without saying that the 2026 high at 99.18 (achieved back in April 8 on the failed ceasefire attempt) serves as the structural ceiling.
- Structural Floor: 97.60-97.80 stands as the established floor in this case. A breakdown below 97.60 on the confirmed close would lead to a retest of 97.00 followed by Cambridge 90-96 year-end target.
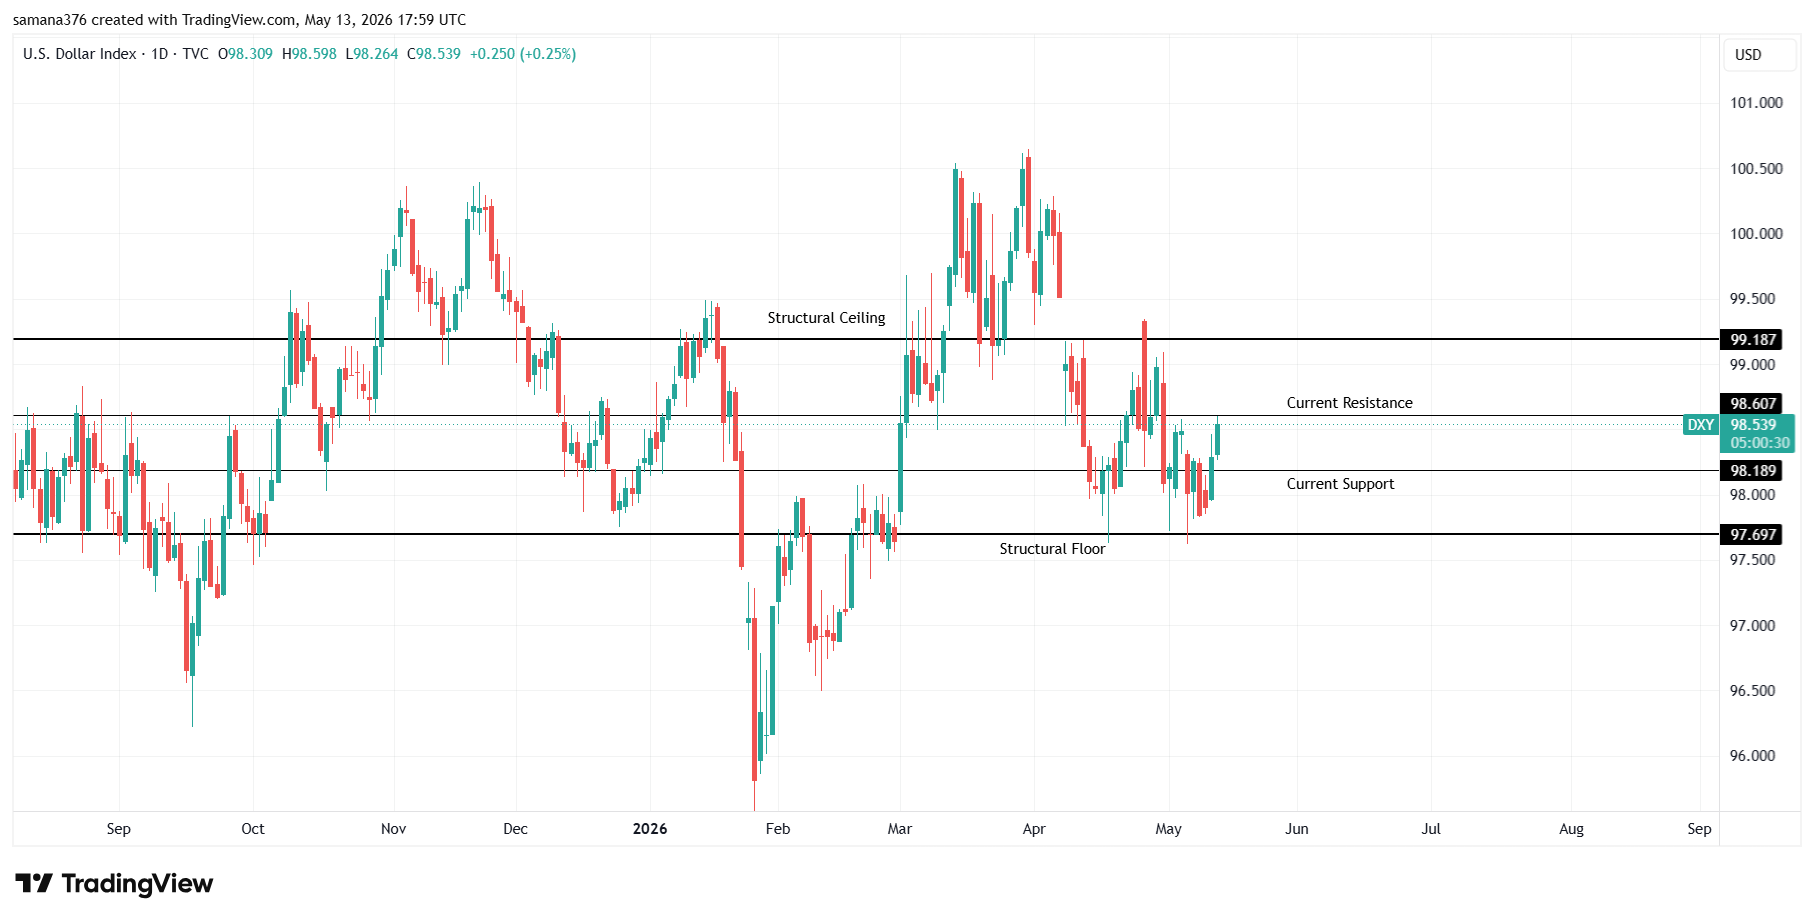
Image Source: Trading View
At the moment, the dollar is being pulled towards 98.60 due to the CPI/PPI surprises and growing pessimism about the possibility to achieve peace in Iran. Once the reflationary effects are exhausted, the structural factors of dollar bearishness would return – including fiscal expansion, Fed hawkishness constrained by a supply shock, and a war that increases both oil prices and weakens consumer demand. The bias above 98.20 remains negative in my view until the dollar closes above 98.60 on the daily timeframe.
How the Dollar Drives Other Financial Markets
Once you understand the situation around the USD Index, the outlook of best assets during inflation and war becomes obvious:
- Crude Oil: It is hovering around $101 per barrel (WTI) and $103.8 per barrel (Brent). Peace agreement between Washington and Tehran would be bullish for oil and bearish for the dollar. As the IEA warns, global oil reserves "are rapidly shrinking," which should create a near-term floor for Brent. To track US-Iran war effect on oil prices, be on the watch for the test of $100 level, which would indicate that peace negotiations are moving ahead.
- Gold: After the inflation data was released, gold suffered a sharp sell-off with a test of the support near $4,600. Why is gold falling if inflation is rising?Well, gold is mostly priced by real yields. When inflation rises, and Federal Reserve prepares for more rate hikes, real yields become extremely attractive. Gold waits for the Fed to blink.
- Silver: Opened at $86.36, it went as high as $88.3 by mid-day (2.23% daily gain). The silver price rally has continued for seven days in a row (from $72 to $88.3 in just seven trading days). But silver is the precious metal that reacts quickly to any dovish signals from Washington or Beijing, because at the moment, the gold/silver ratio stands at 53:1.
- EUR/USD: The euro-dollar pair is hovering near 1.1710 as the dollar strengthens against it. EUR/USD is a direct beneficiary of the peace talks. By H2 2026, according to Cambridge's forecasts, the pair is expected to reach 1.18-1.23, but this will only happen once the Strait of Hormuz opens again.
- US Stocks: Yesterday, NASDAQ fell 0.87%, and the S&P 500 dropped 0.67% amid stock market inflation fears. S&P 500 futures struggle to recover from a loss caused by 1.4% MoM PPI print. Defensives outperformed, semiconductors underperformed.
What’s Next?
The Trump-Xi summit will take place in Beijing today through Friday. Iran issue will be discussed during the talks, although Trump himself says that the main topic will be trade relations. The market expects a clear sign that Beijing favors peace talks – a general statement that the conversations were productive would have little impact, while a promise to address the issue in more detail would be a game changer.
- Today's 6.0% print has killed the chance of rate cuts for good. If the dollar cannot break 99.18, it would mean that the bull run has finished.
- The Handover: Janet Yellen will hand the keys to the new Fed Chair, Jerome Warsh, on Friday. His first public appearance in that role will attract attention of each and every fixed income trader in the world.
The dollar isn't going anywhere anytime soon – and it's waiting for the hawkish chair to give some reactions to 6.0% inflation rate. There is nothing much that can be done right now but knowing the levels and triggers.
Written by: Saman Ali
Disclaimer:
This article is for informational and educational purposes only and does not constitute financial, investment, trading, or legal advice. Always do your own research or consult a licensed advisor before making trading decisions.


Forex Blog Articles
- What is Cryptocurrency?
- Forex Triangular Arbitrage Strategy
- What are the top 5 forex platforms
- What is algorithmic trading and how does it work?
- Reactions During Our Trading
- What is forex trading?
- What are currency swap lines and how do they work?
- 5 Things to check before starting your trading session
- How to backtest your forex trading strategies
- Why is fundamental analysis important in trading?
