

Displaying items by tag: stocks
Big Tech Q1 2026 Earnings: AI Winners, Losers & Nvidia Outlook

Big Tech Just Had Its Best Quarter in Years. So Why Is the Market Still Nervous?
What happens when the biggest problem facing tech stocks is not poor earnings... but impossible expectations?
That is the true story of Q1 2026 earnings season.
On the surface, tech stocks just delivered one of their best earnings reports in recent memory. But beneath the headlines, something even more interesting is occurring: artificial intelligence is driving a huge divide within the tech sector itself. Some stocks are about to enter an accelerated growth cycle. Other stocks are quietly being left behind.
And now, with Nvidia set to report earnings tonight, we're finally going to see if the bull run in artificial intelligence can keep going... or whether the tech market has become too optimistic about its future growth.
If you're invested in tech stocks right now, then this is the earnings briefing you need.
The Earnings Season That Changed Wall Street's Expectations
The numbers were astounding.
Despite more than 90% of S&P 500 companies having already reported Q1 2026 earnings, profit growth is currently tracking to near 27% growth year over year – double what Wall Street expected heading into earnings season.
That means this has been the best quarterly earnings growth period since 2021.
And with roughly 83% of S&P 500 companies having beaten their forecasts this quarter, that number has actually been even higher than usual.
Then why is the market still nervous?
Because earnings beats do not matter.
Investors no longer want just good results. They want perfection.
S&P 500 companies which missed expectations have fallen short of market indices by almost 5% in the day following earnings. By contrast, companies which beat estimates managed only a modest 1% gain.
Why?
Because strong earnings are already baked in.
The market is now assuming AI-driven growth will continue accelerating.
And that makes the next few days very important.
The Big Tech Earnings Scorecard: Who Really Won?
The most intense earnings battle took place the week of April 29th, when Microsoft, Alphabet, Amazon, and Meta all released earnings on consecutive days before Apple did on the fifth.
But despite all of them having performed well in terms of earnings growth, not all big tech stocks impressed investors.
|
Metric |
Alphabet |
Amazon |
Microsoft |
Apple |
Meta |
|
Q1 2026 Revenue |
$109.9B |
$181.5B |
$82.9B |
$111.2B |
$56.31B |
|
Revenue Growth YoY |
+22% |
+17% |
+18% |
+17% |
+33% |
|
Core AI / Cloud Segment |
Google Cloud |
AWS |
Azure |
Services Ecosystem |
AI Advertising & Infrastructure |
|
AI / Cloud Growth |
Google Cloud +63% |
AWS +28% |
Azure +40% |
Services margins ~77% |
Ad revenue + AI monetization acceleration |
|
Earnings Highlight |
Net income +81% |
EPS nearly doubled estimates |
AI business ARR reached $37B |
EPS +22%, China sales +28% |
Daily active users hit 3.58B |
|
AI Infrastructure Spending |
2026 capex guide: $180B–$190B |
Planning over $200B capex |
Projected ~$190B capex |
Roughly $13B annual capex |
$115B–$135B AI capex guide |
|
Investor Reaction |
Biggest winner of earnings season |
Positive but underhyped |
Strong results but muted reaction |
Investors split on AI positioning |
Stock dropped nearly 7% post-earnings |
|
Biggest Investor Concern |
Rising AI spending intensity |
Can margins hold during massive expansion? |
OpenAI exclusivity ending |
Is Apple falling behind in AI? |
Spending rising faster than monetization |
|
Main Bullish Thesis |
Fastest-growing hyperscaler with huge AI backlog |
AWS becoming backbone of AI infrastructure |
Enterprise AI dominance |
Massive profitability with low capex |
Unmatched scale for AI-driven advertising |
|
Key Market Narrative |
AI strategy clearly working |
Quiet AI infrastructure giant |
Great results no longer enough |
Efficiency vs AI race debate |
Market demanding faster AI returns |
1- Alphabet was the Clear Winner
Alphabet delivered one of the strongest quarters of the bunch.
Its Google Cloud business generated a remarkable 63% year-over-year growth to $20 billion, which accelerates dramatically from 48% growth in Q4 2025, and now makes Google Cloud the fastest-growing hyperscaler in this cycle.
Why?
Because Alphabet proved yet again that its entire AI strategy is working.
From custom AI chips to an ever-growing backlog of orders, a strong search engine ad market, to cloud acceleration, everything is pointing to one thing:
Alphabet becoming one of the leading AI infrastructure companies on Earth.
And investors can tell.
2- Amazon Quietly Built an AI Advantage of its Own
AWS growth soared by 28% year over year to $37.6 billion.
It's the strongest cloud growth Amazon has seen in 13 consecutive quarters.
Advertising revenues rose 23%.
But the real story is infrastructure.
All major AI labs use AWS computing power, while Amazon is planning to spend over $200 billion in capex in the upcoming year in anticipation of growing AI demand.
Here's the question investors need to answer now:
Could Amazon become one of the biggest AI infrastructure leaders without drawing the same investor attention as Nvidia and Microsoft?
3- Microsoft Had Excellent Results But Not Good Enough for Markets
In Q1 2026, Microsoft delivered Azure growth of 40% and total revenue of $82.9 billion.
Historically, such numbers would've generated a monumental rally.
But this time, investors responded quite tepidly.
Why?
Because Microsoft suddenly appeared somewhat underwhelming compared to Alphabet's growth in its cloud services.
Not only did Microsoft end its exclusive partnership with OpenAI, giving its competitor free access to all its frontier models until 2032, but it also made many investors question:
Is Microsoft's dominance in AI over now?
4- Apple Stock May Be the Most Exciting One to Watch in Tech This Year
Apple delivered arguably the best results of the season.
Q1 2026 saw total revenue grow 17% to $111.2 billion, and EPS jump by 22%. Greater China sales skyrocketed by 28% to $20.5 billion, and the company's services segment maintained its acceleration with gross margins staying at about 77%.
However, investors' eyes cannot stop looking at a single number:
Apple managed all of this while spending no more than $13 billion per year on capex investments.
How does that compare to Microsoft's projected $190 billion, and Amazon's $200 billion AI buildout in the year ahead?
Now investors have to decide for themselves:
Was Apple able to generate spectacular results while saving billions over its competitors' costs in AI infrastructure projects?
Or is the technology giant quietly lagging in AI development?
This question will define Apple's valuation in the coming two years.
5- Meta Revealed Investors' Biggest Fear in AI
Meta delivered excellent results once again with 33% y-o-y and $56.31 billion in revenue.
Ad growth stayed robust, while daily active users reached a staggering 3.58 billion users.
But investors ignored the positive numbers, fixating their sights on expenses.
Meta said it plans to spend between $115 billion to $135 billion building AI infrastructure next year alone.
The stock dropped almost 7% after earnings.
That move reveals something important about today's market:
Investors only reward heavy AI spending when returns rise faster than costs.
If spending is outpacing monetization, investors punish the companies involved ruthlessly.
AI Is Creating an Emerging Class of Winners and Losers Among Tech Stocks
Another trend emerging during this earnings season is the huge performance discrepancy between technology stocks.
Since the start of Q1 2026 earnings, there has been a difference of 133 percentage points between the top-performing and worst-performing stocks in technology this year.
The gap is widening. Three years ago, the discrepancy between tech stocks barely reached 75 points.
The time of AI lifting the entire industry is over. Now some companies are starting to emerge as leaders in this field.
The Winners: Tech Stocks Focused on Hardware and Semiconductors
As you would probably expect, the winners this earnings season include companies focusing on AI infrastructure development.
SanDisk shares are up a whopping 511% YTD. Intel delivered blowout Q1 results which pushed its revenue up over 225%. Seagate Technology and Western Digital have soared by roughly 194% and 183%, respectively.
VanEck Semiconductor ETF has surged by 58% YTD, too.
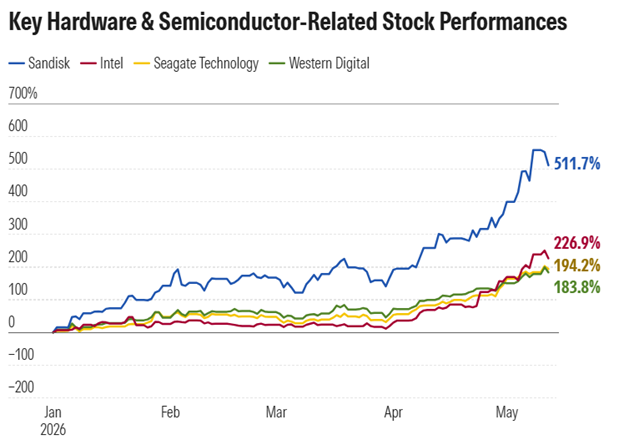
Image Source: Morningstar
Why?
Because artificial intelligence needs a lot of semiconductors, chip memory, networking, and storage solutions to process massive amounts of data.
The Losers: AI-Destroyed Software Companies
The software sector has experienced massive pain this earnings season.
Over 75% of stocks in the Morningstar US Technology Index are negative in 2026.
HubSpot's stock price is down almost 50%. Atlassian's shares are down about 47%. Workday has dropped by roughly 44%.
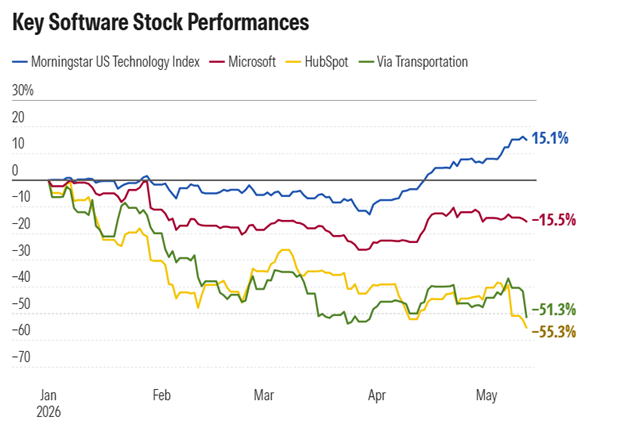
Image Source: Morningstar
Why?
Because more and more software investors are worrying about AI potentially disrupting their companies' business models.
That may end up being overly pessimistic. After all, many analysts predict that software companies will simply adapt to new technologies.
But for investors in technology stocks, that means taking a chance.
Holding a broadly-diversified tech stock ETF no longer means getting great exposure to AI innovation. Many of those indexes now contain software stocks that can significantly drag down AI's gains.
The First Phase of Artificial Intelligence IPO Boom Is Here
The next phase of the AI growth cycle is starting now with several IPOs.
Last week, Cerebras Systems debuted on Nasdaq in what's shaping up to be the biggest tech IPO since Uber's initial listing in 2019.
The company raised $5.55 billion, opening its trading at $350 per share, and closing with a 68% increase to a valuation of about $95 billion.
Cerebras builds AI-focused wafers-cale processors for inferencing purposes – the area investors worry could soon become AI's main bottleneck.
But besides signing a $20 billion cloud deal with OpenAI and a massive infrastructure contract with Amazon Web Services, the company faces competition from Nvidia, and poses real customer concentration risks.
Investors should therefore be careful.
But there's another message the market wants to send clearly:
The appetite for AI companies listed on the Nasdaq remains immense.
And the IPO pipeline ahead with Databricks, OpenAI, Anthropic, and Elon Musk's SpaceX xAI company merger, could soon provide us with the biggest wave of tech listings in years.
Nvidia Earnings Could Decide the Future of All AI-Related Stocks
The coming earnings season will hinge on Nvidia's performance.
The street predicts the tech titan will deliver adjusted EPS of about $1.77, and a revenue number of $78.9 billion for this quarter – both implying over 79% YOY growth.
But what truly caught everyone's attention is Nvidia's Q1 data center revenue, predicted to exceed $73.3 billion, which is a near 87% rise from last year.
And with analysts predicting Nvidia's FY 2027 revenues reaching almost $370 billion (about 71% growth), tonight's earnings become extremely crucial.
Why?
Because the market stopped caring about earnings misses long ago.
They assume Nvidia will beat analysts' expectations.
But tonight they'll want to see something different:
Strong guidance for future earnings driven by Nvidia's Blackwell AI chips, hyperscaler demand, and AI spending in infrastructure.
The Two Risks Facing Nvidia and All Artificial Intelligence-Linked Companies
But there are two other problems tech stocks are facing right now.
Rising bond yields and crude oil prices.
Yields on the 10-year and 30-year US Treasuries have climbed to 4.6% and 5.2%, respectively. 30-Year US treasury hit its highest level in 19 years since 2007.
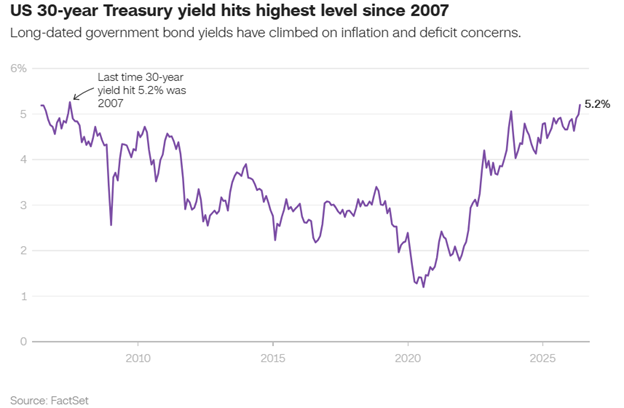
Oil prices are also on the rise due to Strait of Hormuz supply issues, now pushing them above $100 per barrel. This is fuelling fears of renewed inflation and potential tightening by the Federal Reserve.
Why is this relevant?
Because rising bond yields hurt companies valued primarily on their future growth, cutting down the present value of their future cash flows.
That is why the Nasdaq fell and several stocks in Magnificent Seven declined despite posting blowout results.
That leaves two risks investors must consider while watching Nvidia's earnings:
Will the AI growth narrative remain intact for investors? And can artificial intelligence momentum offset rising bond yields?
If Nvidia's guidance for FY 2027 turns out solid and positive for investors with news on Blackwell AI chips, hyperscalers' demands, and AI infrastructure spending... Then Nvidia's decline after the report will create another buying opportunity for premium artificial intelligence stocks.
But if Nvidia fails to impress, rising bond yields can spark a much deeper correction among the entire class of AI tech stocks.
Written by: Saman Ali
Disclaimer:
This article is for informational and educational purposes only and does not constitute financial, investment, trading, or legal advice. Always do your own research or consult a licensed advisor before making trading decisions.
How the Iran Conflict Is Impacting the Dollar, Gold, Oil, Stocks, and Treasury Markets

How the Iran Conflict Is Impacting the Dollar, Gold, Oil, Stocks, and Treasury Markets
In just five trading sessions, markets went from debating Fed cuts to preparing for possible rate hikes in 2027. Behind that shift: exploding war costs, a 6.0% PPI shock, and a dollar that refuses to weaken.
In this article, we discuss the impact of Middle East tensions on markets, how defense spending affects the economy, why the Fed may not cut rates in 2026, why the dollar is strengthening again, Key DXY levels to monitor, and why gold is falling despite inflation.
Pentagon Raised Warning of Increased War Costs
According to the Pentagon's testimony to Congress, the ongoing Operation Epic Fury has already cost American taxpayers $29 billion so far this year. In other words, the cost of the US-Iran conflict increased by $4 billion just in two weeks' time. Pentagon's acting comptroller Jay Hurst says that roughly $24 billion of those expenses were needed to repair and replace the equipment destroyed by the war. "But we have a lot of unknowns there," says Hurst, referring to expenses for repairs at US military bases damaged in the fighting.
How does the Iran war affect the US dollar? Fiscal impacts from such a large-scale conflict are not to be ignored, especially when the Department of Defense is now trying to push for an extra $1.5 trillion for US defense budget 2027. At the same time, Republican congressman and head of the House defense subcommittee Ken Calvert asked whether the operation would have a negative impact on US military readiness over the long term.
These concerns show the first signs of a hawkish shift in fiscal policy among fellow Republicans who stand alongside the White House. In other words, war spending will lead to widening budget deficits and a growing supply of US government bonds, causing further crowding out effects for private investment.
In addition to fiscal impacts, there is an even faster one that is likely to come through the channel of energy.
How Iran War is Impacting US Inflation and Fed Decisions?
April CPI came in at 3.8% y-o-y, which is the highest figure since May 2023 and above the consensus forecast of 3.7%. Meanwhile, the rise in energy costs was as high as 17.9% y-o-y, while gasoline prices increased by 28.4% y-o-y, and fuel oil prices by 54.3% y-o-y. What is especially concerning to investors: core CPI, excluding food and energy, jumped 0.4% m-o-m and 2.8% y-o-y, above expectations.
But that was nothing compared to today's print. The latest PPI reading stood at 6.0% y-o-y and crushed the consensus estimate of 4.9%. Month-over-month change in producer prices also skyrocketed, reaching 1.4% and almost three times exceeding the anticipated 0.5% increase. What does it mean? If producer prices continue to grow at such a fast pace, the inflationary pressure in the consumer sector remains intact as well. Excluding food, energy, and trade, core PPI increased by 0.6% m-o-m and 4.4% y-o-y. Read our latest analysis to learn more about oil war’s impact on food prices.
Now to answer the question; Will the Fed cut rates in 2026?It doesn't really require deep expertise in economics to realize that this data kills the whole idea of rate cuts in H2 2026. Bank of America recently moved its projections for the first rate cut to H2 2027. According to the CME Fed Watch index, currently, zero chances are seen for rate cuts in 2026, while 70+ percent probability stands for a rate hike in April 2027. In terms of interest rates, this represents an enormous re-pricing over just five trading sessions.
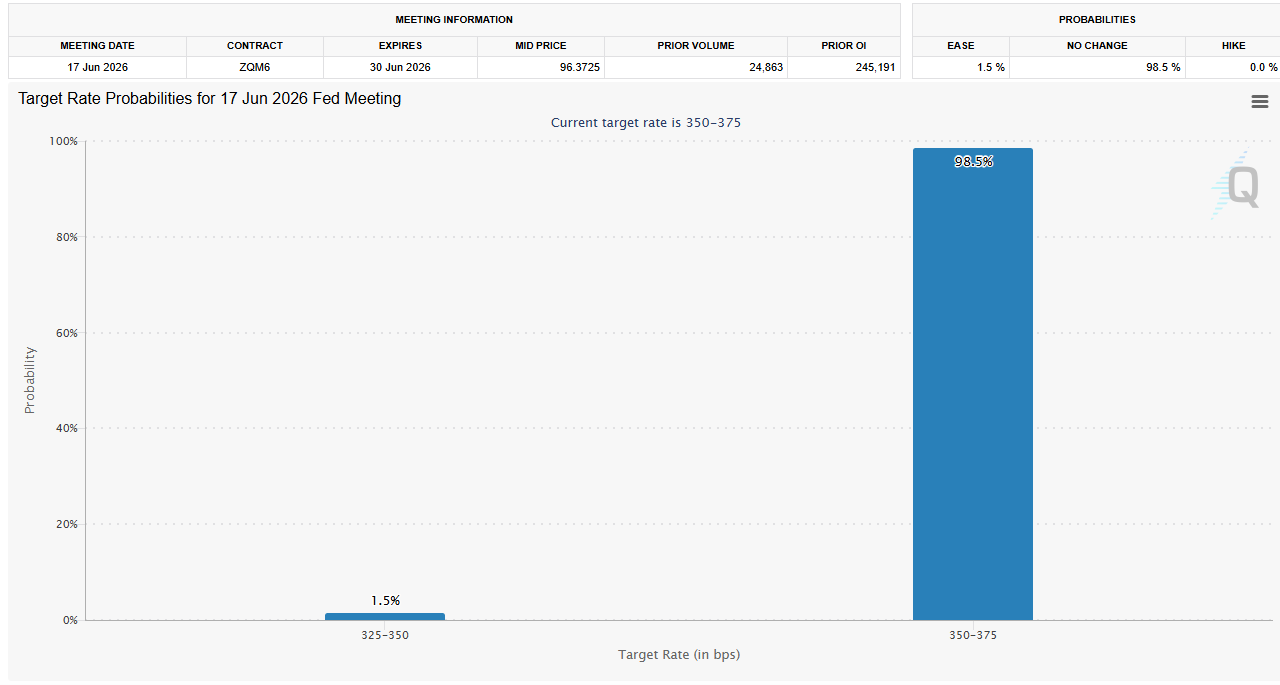
Image Source: CME FedWatchTool
Bond Market Update
As for the impact on treasury markets, bond yields have soared after the latest release. 2-year yield rose above 4%, whereas 10-year yield climbed to the highest level in ten months at 4.48%.
Dollar Index Technical Analysis (DXY)
The USD Index is currently sitting at 98.60 as a support for the safe haven amid an inflation surprise and rising tensions in the Middle East.
- Structural Ceiling: It goes without saying that the 2026 high at 99.18 (achieved back in April 8 on the failed ceasefire attempt) serves as the structural ceiling.
- Structural Floor: 97.60-97.80 stands as the established floor in this case. A breakdown below 97.60 on the confirmed close would lead to a retest of 97.00 followed by Cambridge 90-96 year-end target.
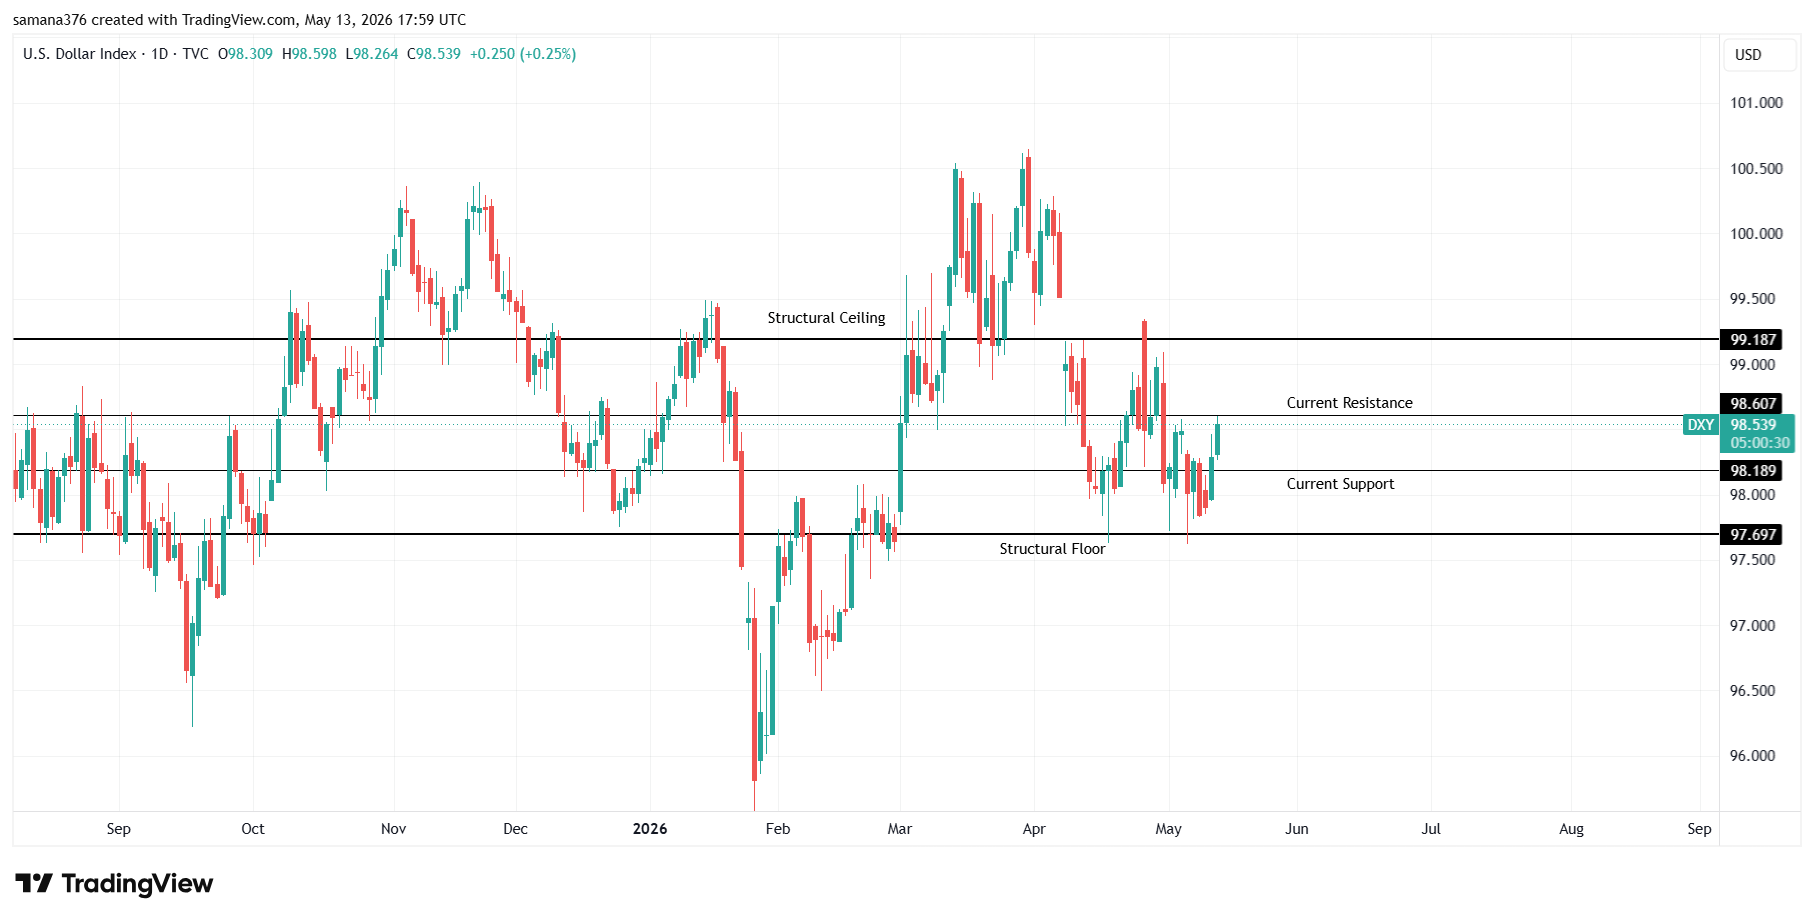
Image Source: Trading View
At the moment, the dollar is being pulled towards 98.60 due to the CPI/PPI surprises and growing pessimism about the possibility to achieve peace in Iran. Once the reflationary effects are exhausted, the structural factors of dollar bearishness would return – including fiscal expansion, Fed hawkishness constrained by a supply shock, and a war that increases both oil prices and weakens consumer demand. The bias above 98.20 remains negative in my view until the dollar closes above 98.60 on the daily timeframe.
How the Dollar Drives Other Financial Markets
Once you understand the situation around the USD Index, the outlook of best assets during inflation and war becomes obvious:
- Crude Oil: It is hovering around $101 per barrel (WTI) and $103.8 per barrel (Brent). Peace agreement between Washington and Tehran would be bullish for oil and bearish for the dollar. As the IEA warns, global oil reserves "are rapidly shrinking," which should create a near-term floor for Brent. To track US-Iran war effect on oil prices, be on the watch for the test of $100 level, which would indicate that peace negotiations are moving ahead.
- Gold: After the inflation data was released, gold suffered a sharp sell-off with a test of the support near $4,600. Why is gold falling if inflation is rising?Well, gold is mostly priced by real yields. When inflation rises, and Federal Reserve prepares for more rate hikes, real yields become extremely attractive. Gold waits for the Fed to blink.
- Silver: Opened at $86.36, it went as high as $88.3 by mid-day (2.23% daily gain). The silver price rally has continued for seven days in a row (from $72 to $88.3 in just seven trading days). But silver is the precious metal that reacts quickly to any dovish signals from Washington or Beijing, because at the moment, the gold/silver ratio stands at 53:1.
- EUR/USD: The euro-dollar pair is hovering near 1.1710 as the dollar strengthens against it. EUR/USD is a direct beneficiary of the peace talks. By H2 2026, according to Cambridge's forecasts, the pair is expected to reach 1.18-1.23, but this will only happen once the Strait of Hormuz opens again.
- US Stocks: Yesterday, NASDAQ fell 0.87%, and the S&P 500 dropped 0.67% amid stock market inflation fears. S&P 500 futures struggle to recover from a loss caused by 1.4% MoM PPI print. Defensives outperformed, semiconductors underperformed.
What’s Next?
The Trump-Xi summit will take place in Beijing today through Friday. Iran issue will be discussed during the talks, although Trump himself says that the main topic will be trade relations. The market expects a clear sign that Beijing favors peace talks – a general statement that the conversations were productive would have little impact, while a promise to address the issue in more detail would be a game changer.
- Today's 6.0% print has killed the chance of rate cuts for good. If the dollar cannot break 99.18, it would mean that the bull run has finished.
- The Handover: Janet Yellen will hand the keys to the new Fed Chair, Jerome Warsh, on Friday. His first public appearance in that role will attract attention of each and every fixed income trader in the world.
The dollar isn't going anywhere anytime soon – and it's waiting for the hawkish chair to give some reactions to 6.0% inflation rate. There is nothing much that can be done right now but knowing the levels and triggers.
Written by: Saman Ali
Disclaimer:
This article is for informational and educational purposes only and does not constitute financial, investment, trading, or legal advice. Always do your own research or consult a licensed advisor before making trading decisions.
Technical Analysis in Trading: The Map, The Trap, and The Edge

Technical Analysis in Trading: The Map, The Trap, and The Edge
Technical analysis is the most widely used methodology in speculative markets, and ironically, the most widely misunderstood. Traders deploy TA across forex, CFDs, cryptocurrencies, stocks, shares, commodities, and indices believing they are gaining foresight into future price. What they are often gaining instead is pattern recognition bias dressed as analysis, and that bias is the single fastest route to capital destruction. Unlike investing, trading operates in leveraged environments, tight invalidation windows, and rapidly shifting market regimes — meaning TA was never designed to tell you what will happen, but to tell you what is happening, and more importantly, what must not happen for your idea to remain valid. The trader who confuses interpretation with prediction eventually loses everything, not because TA doesn’t work, but because they used it for a purpose it was never meant to serve.
The Anatomy of the Technical Illusion
Retail traders approach charts like historians searching for repetition. They believe if price bounced off a level before, that level now carries an invisible force field into the future. This creates the illusion of control and certainty. The market occasionally rewards this thinking, not because the analysis was correct, but because price simply revisited a liquidity pool that happened to align with a drawn level. The danger lies in the other 90% of the time, when price doesn’t respect those levels at all — it weaponizes them. Markets are engineered around liquidity consumption. Support and resistance are often not barriers, but magnets, used by institutions to trigger stop-loss waterfalls, fill large orders, and reverse price only after retail capital has been harvested. The chart looks predictable in hindsight, but unpredictable in execution, which is exactly how the trap is constructed.
Examples of Static TA Thinking That Would Destroy Traders

1. “Historical Support Always Holds” – The Nasdaq Fallacy
Consider the Nasdaq 100 index — a favorite CFD instrument for global traders. If a trader in 2010 had studied the previous decade of price action, they would have found a clean market structure of swing lows repeatedly defending the 1800–2200 zone. A static-thinking technician would conclude that future pullbacks into this region must present long opportunities. Fast forward to 2020, when the index collapsed from 9700 to 6600 in under one month — ripping through 10 years of historic support. Traders who bought because “support always held in the past” would have endured a 30% loss in weeks on leveraged margin. Many would double down at 7200, believing in mean reversion, only to face further liquidation sweeps before price recovered. Then again in 2022, Nasdaq fell from 16,500 to 10,500, a 36% drop, once more ignoring long-term structure entirely. A trader using high CFD leverage without invalidation logic wouldn’t lose 30% or 50% — they would lose 100%, repeatedly re-entering the same collapsing zones until margin failure. The mistake wasn’t technical analysis — the mistake was believing that TA predicted the future instead of describing the present. TA should have told them: “If price closes below 6600, the long idea is invalid — regardless of history.” But history blinded them, and the market punished them for it.
2. “Resistance = Reversal” – The XAU/USD Trap
Gold (XAU/USD) has been in a powerful macro uptrend over the past 2+ years, making it one of the most attractive CFD instruments for breakout and carry-flow traders. Between 2023 and 2025, price formed extremely visible resistance zones at 1930, 1985, 2050, 2075, 2145, and 2200. Retail traders treated each as a reversal fortress. Every indicator screamed overbought. RSI sat above 70 for weeks at a time. MACD was extended. Commentators called for correction after correction. What actually happened? Gold blew through each resistance zone, sometimes retraced briefly, and then continued trending 400–1200+ pips higher. Traders who sold at resistance without regime awareness experienced a phenomenon that destroys most technicians:
-
Overbought stayed overbought
-
Resistance became support after liquidity sweeps
-
Stop losses were triggered above highs before real reversals
-
Trend continuation made static levels irrelevant
In leveraged CFDs, this behavior would repeatedly liquidate traders selling resistance, even though the analysis looked logical. The market didn’t reverse because resistance was broken — it reversed after liquidity was consumed beyond resistance, once institutions were filled. The professor’s rule applies: “A level is only valid until price behavior invalidates the thesis.” Not a second longer.
3. The “Carry Pair = Safe Support” Catastrophe
Let’s take carry trading favorites like USD/TRY or USD/ZAR, often traded via CFD platforms for swap or trend exploitation. A trader may analyze USD/TRY from 2018 to 2020 and observe repeated price stabilization around 5.80–6.20. Support looks impenetrable. But by 2023 the pair traded above 25.00 — a 300%+ currency devaluation, completely disregarding previous structure. Even if swap was positive, any leveraged trader holding longs at historic support without invalidation rules would be obliterated, because the market shifted regime entirely when inflation dynamics, central bank credibility, and macro volatility altered capital flows. Technical analysis should have told them to adjust SL and trend bias using volatility measures like ATR or momentum filters like ADX, but static level reliance would have wiped them out long before swap accumulation mattered.
4. “Chart Patterns Always Play Out” – The Bitcoin Graveyard
Crypto markets are TA-heavy ecosystems, meaning the trap density is even higher. Between 2021 and 2024, Bitcoin formed dozens of textbook patterns:
-
Double tops at 69,000
-
Head & Shoulders breakdowns
-
Bull flags
-
Falling wedges
-
Ascending triangles
Retail traders treated each as a future guarantee. What did the market do instead? It delivered fakeouts in both directions, sweeping lows to 15,500 in 2022 (-77%), then rallying back to 73,000 in 2024, trapping shorts and longs symmetrically. Traders who believed chart patterns guaranteed price direction were wiped out not by market movement, but by market sequencing — liquidity sweeps first, narrative logic last. The lesson here for all markets is that TA must evolve into a rules-based framework:
“If the pattern fails, the trade fails. If the market regime changes, the strategy changes. If liquidity is taken, wait for confirmation, not nostalgia.”
TA Best Practices That Keep Traders Alive

1. Think in Scenarios, Not Forecasts
Professional traders never conclude with “price will go here.” They conclude with:
-
“If price breaks and closes above this range → continuation likely.”
-
“If price rejects after liquidity sweep → reversal scenario active.”
-
“If volatility expands beyond threshold → reduce size or widen risk logic.”
This keeps ego out of execution and capital alive long enough for probability to matter.
2. Invalidation Is More Important Than Confirmation
Most traders look for confirmation. Professionals look for invalidation first. A good rule:
-
A trend trade is dead when structure breaks against position and holds
-
A range trade is dead when expansion invalidates mean-reversion logic
-
A pattern trade is dead when the pattern fails before RR plays out
TA should protect capital before it attempts to grow it.
3. Use Indicators as Behavioral Filters, Not Directional Oracles
The following indicators are statistically useful when applied correctly:
Trend Identification
-
20/50/200 Moving Averages → directional bias and regime structure
-
ADX → trend strength vs range regime
-
Above 25 = trend confirmation
-
Below 20 = avoid trend strategies
-
Momentum Awareness
-
RSI → only reliable for reversals when market is not trending
-
MACD Histogram → momentum contraction/expansion behavior
Volatility and Risk Distance
-
ATR → SL/TP distance based on true volatility
-
Bollinger Band Squeeze → breakout loading detection, not breakout direction
Volume (Critical for Crypto, Shares, Indices, CFDs)
-
Volume Profile → institutional value zones
-
VWAP → fair-value pricing bias
-
Relative Volume spikes → participation detection
A clean chart with 2–3 behavioral filters outperforms a noisy chart with 10 indicators every time.
TA Conclusion Every Trader Must Internalize
Technical analysis is essential in every speculative market because it reveals participation, structure, momentum, and liquidity faster than any fundamental headline ever will. But the moment a trader believes TA gives them future knowledge, they detach from reality and attach to bias — and the market always punishes that transition. Nasdaq would have destroyed anyone relying on 20-year support lines. Gold would have destroyed anyone selling every resistance tap for 2 years. Bitcoin would have liquidated anyone trusting every textbook pattern without invalidation logic. TA is not the art of being right — it is the art of structuring decisions, defining risk, reading behavior, and executing with discipline in uncertainty.
The future of price is unknown. The risk on your trade should never be. That is the edge.
Disclaimer:
This article is for informational and educational purposes only and does not constitute financial, investment, trading, or legal advice. Always do your own research or consult a licensed advisor before making trading decisions.
Our #1 Trusted Partner - TiBiGLOBE


Forex Blog Articles
- CTrader Vs Metatrader 4 (MT4)
- Three indicators that work best with Bollinger bands
- 5 Things to check before starting your trading session
- Three types of trading principles that you should know
- All you need to know about the U.S. dollar Index
- How to combine different types of analysis in Forex?
- Forex Triangular Arbitrage Strategy
- How to Trade with a Pending Order?
- Signs you have what it takes to be a Forex Trader
- Five things to know about the Bank of England
