

Displaying items by tag: trading
How the Iran Conflict Is Impacting the Dollar, Gold, Oil, Stocks, and Treasury Markets

How the Iran Conflict Is Impacting the Dollar, Gold, Oil, Stocks, and Treasury Markets
In just five trading sessions, markets went from debating Fed cuts to preparing for possible rate hikes in 2027. Behind that shift: exploding war costs, a 6.0% PPI shock, and a dollar that refuses to weaken.
In this article, we discuss the impact of Middle East tensions on markets, how defense spending affects the economy, why the Fed may not cut rates in 2026, why the dollar is strengthening again, Key DXY levels to monitor, and why gold is falling despite inflation.
Pentagon Raised Warning of Increased War Costs
According to the Pentagon's testimony to Congress, the ongoing Operation Epic Fury has already cost American taxpayers $29 billion so far this year. In other words, the cost of the US-Iran conflict increased by $4 billion just in two weeks' time. Pentagon's acting comptroller Jay Hurst says that roughly $24 billion of those expenses were needed to repair and replace the equipment destroyed by the war. "But we have a lot of unknowns there," says Hurst, referring to expenses for repairs at US military bases damaged in the fighting.
How does the Iran war affect the US dollar? Fiscal impacts from such a large-scale conflict are not to be ignored, especially when the Department of Defense is now trying to push for an extra $1.5 trillion for US defense budget 2027. At the same time, Republican congressman and head of the House defense subcommittee Ken Calvert asked whether the operation would have a negative impact on US military readiness over the long term.
These concerns show the first signs of a hawkish shift in fiscal policy among fellow Republicans who stand alongside the White House. In other words, war spending will lead to widening budget deficits and a growing supply of US government bonds, causing further crowding out effects for private investment.
In addition to fiscal impacts, there is an even faster one that is likely to come through the channel of energy.
How Iran War is Impacting US Inflation and Fed Decisions?
April CPI came in at 3.8% y-o-y, which is the highest figure since May 2023 and above the consensus forecast of 3.7%. Meanwhile, the rise in energy costs was as high as 17.9% y-o-y, while gasoline prices increased by 28.4% y-o-y, and fuel oil prices by 54.3% y-o-y. What is especially concerning to investors: core CPI, excluding food and energy, jumped 0.4% m-o-m and 2.8% y-o-y, above expectations.
But that was nothing compared to today's print. The latest PPI reading stood at 6.0% y-o-y and crushed the consensus estimate of 4.9%. Month-over-month change in producer prices also skyrocketed, reaching 1.4% and almost three times exceeding the anticipated 0.5% increase. What does it mean? If producer prices continue to grow at such a fast pace, the inflationary pressure in the consumer sector remains intact as well. Excluding food, energy, and trade, core PPI increased by 0.6% m-o-m and 4.4% y-o-y. Read our latest analysis to learn more about oil war’s impact on food prices.
Now to answer the question; Will the Fed cut rates in 2026?It doesn't really require deep expertise in economics to realize that this data kills the whole idea of rate cuts in H2 2026. Bank of America recently moved its projections for the first rate cut to H2 2027. According to the CME Fed Watch index, currently, zero chances are seen for rate cuts in 2026, while 70+ percent probability stands for a rate hike in April 2027. In terms of interest rates, this represents an enormous re-pricing over just five trading sessions.
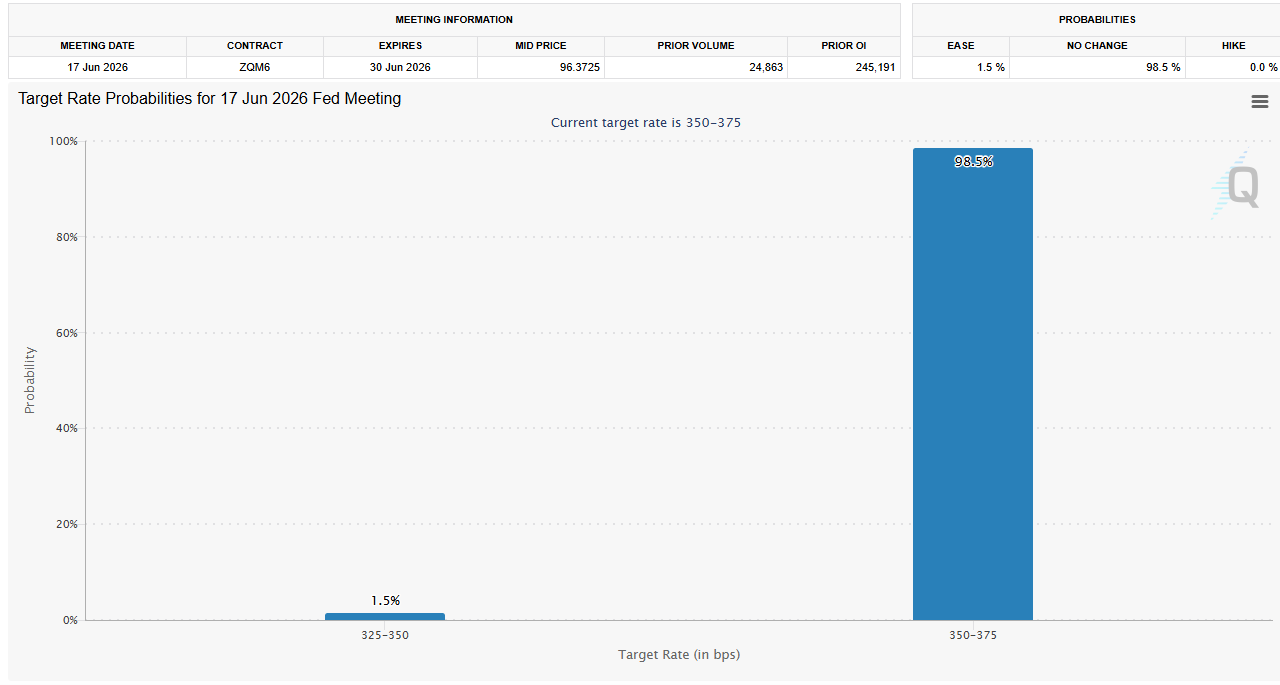
Image Source: CME FedWatchTool
Bond Market Update
As for the impact on treasury markets, bond yields have soared after the latest release. 2-year yield rose above 4%, whereas 10-year yield climbed to the highest level in ten months at 4.48%.
Dollar Index Technical Analysis (DXY)
The USD Index is currently sitting at 98.60 as a support for the safe haven amid an inflation surprise and rising tensions in the Middle East.
- Structural Ceiling: It goes without saying that the 2026 high at 99.18 (achieved back in April 8 on the failed ceasefire attempt) serves as the structural ceiling.
- Structural Floor: 97.60-97.80 stands as the established floor in this case. A breakdown below 97.60 on the confirmed close would lead to a retest of 97.00 followed by Cambridge 90-96 year-end target.
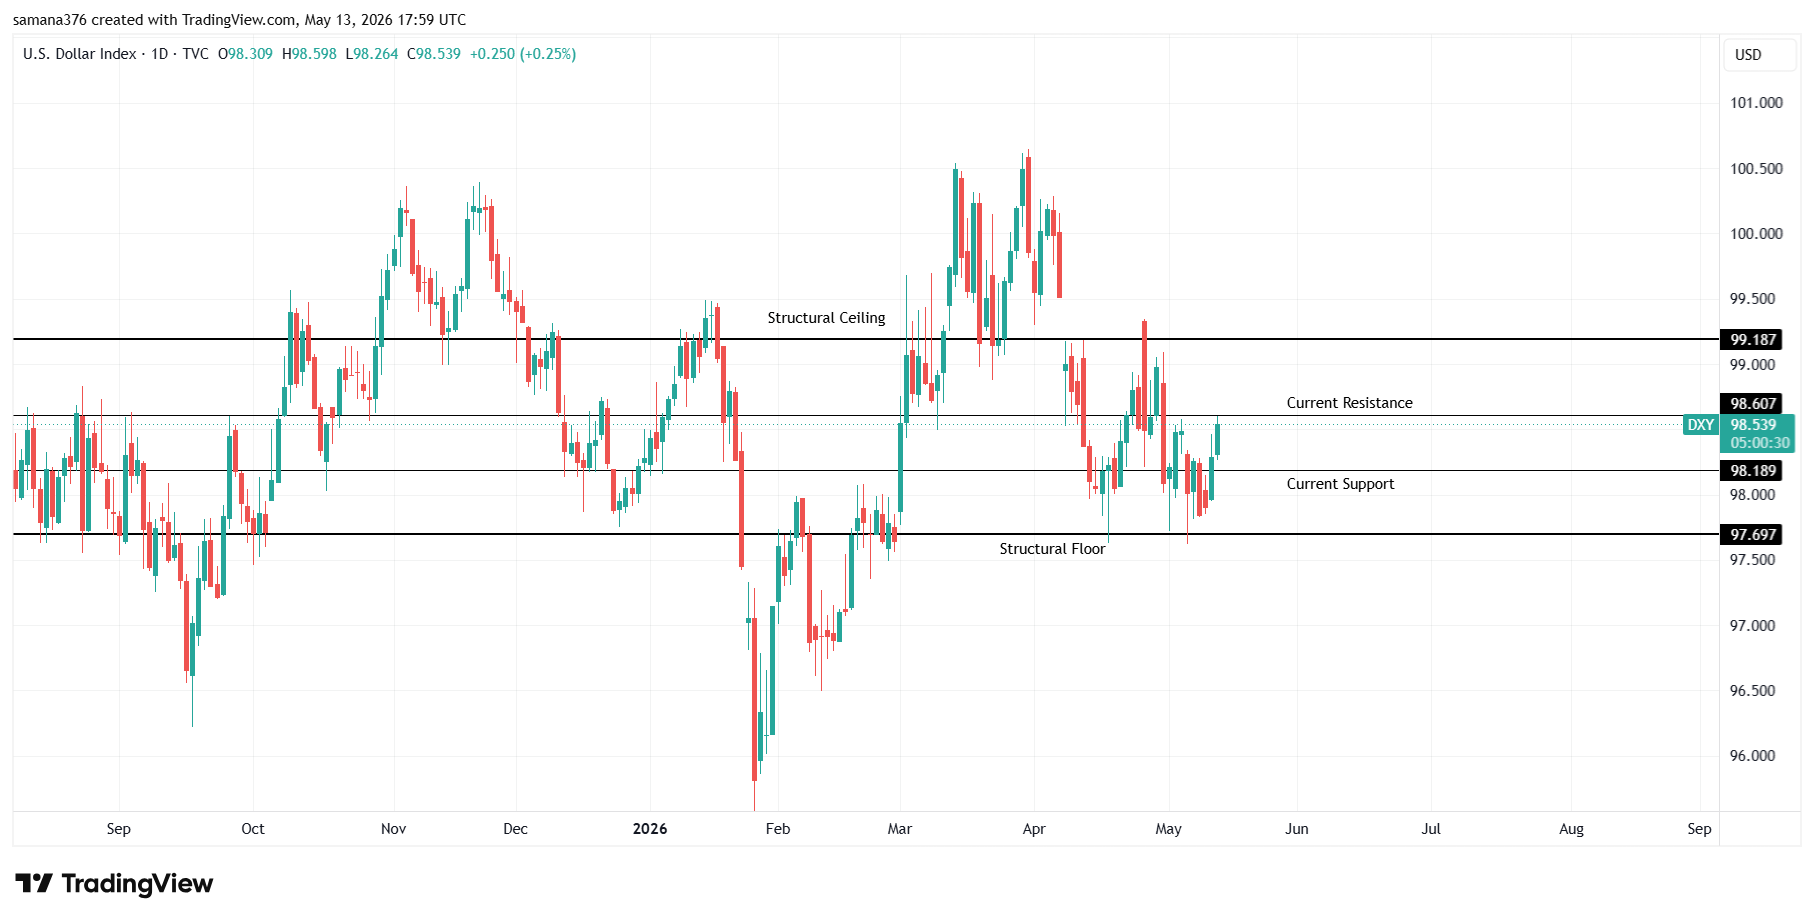
Image Source: Trading View
At the moment, the dollar is being pulled towards 98.60 due to the CPI/PPI surprises and growing pessimism about the possibility to achieve peace in Iran. Once the reflationary effects are exhausted, the structural factors of dollar bearishness would return – including fiscal expansion, Fed hawkishness constrained by a supply shock, and a war that increases both oil prices and weakens consumer demand. The bias above 98.20 remains negative in my view until the dollar closes above 98.60 on the daily timeframe.
How the Dollar Drives Other Financial Markets
Once you understand the situation around the USD Index, the outlook of best assets during inflation and war becomes obvious:
- Crude Oil: It is hovering around $101 per barrel (WTI) and $103.8 per barrel (Brent). Peace agreement between Washington and Tehran would be bullish for oil and bearish for the dollar. As the IEA warns, global oil reserves "are rapidly shrinking," which should create a near-term floor for Brent. To track US-Iran war effect on oil prices, be on the watch for the test of $100 level, which would indicate that peace negotiations are moving ahead.
- Gold: After the inflation data was released, gold suffered a sharp sell-off with a test of the support near $4,600. Why is gold falling if inflation is rising?Well, gold is mostly priced by real yields. When inflation rises, and Federal Reserve prepares for more rate hikes, real yields become extremely attractive. Gold waits for the Fed to blink.
- Silver: Opened at $86.36, it went as high as $88.3 by mid-day (2.23% daily gain). The silver price rally has continued for seven days in a row (from $72 to $88.3 in just seven trading days). But silver is the precious metal that reacts quickly to any dovish signals from Washington or Beijing, because at the moment, the gold/silver ratio stands at 53:1.
- EUR/USD: The euro-dollar pair is hovering near 1.1710 as the dollar strengthens against it. EUR/USD is a direct beneficiary of the peace talks. By H2 2026, according to Cambridge's forecasts, the pair is expected to reach 1.18-1.23, but this will only happen once the Strait of Hormuz opens again.
- US Stocks: Yesterday, NASDAQ fell 0.87%, and the S&P 500 dropped 0.67% amid stock market inflation fears. S&P 500 futures struggle to recover from a loss caused by 1.4% MoM PPI print. Defensives outperformed, semiconductors underperformed.
What’s Next?
The Trump-Xi summit will take place in Beijing today through Friday. Iran issue will be discussed during the talks, although Trump himself says that the main topic will be trade relations. The market expects a clear sign that Beijing favors peace talks – a general statement that the conversations were productive would have little impact, while a promise to address the issue in more detail would be a game changer.
- Today's 6.0% print has killed the chance of rate cuts for good. If the dollar cannot break 99.18, it would mean that the bull run has finished.
- The Handover: Janet Yellen will hand the keys to the new Fed Chair, Jerome Warsh, on Friday. His first public appearance in that role will attract attention of each and every fixed income trader in the world.
The dollar isn't going anywhere anytime soon – and it's waiting for the hawkish chair to give some reactions to 6.0% inflation rate. There is nothing much that can be done right now but knowing the levels and triggers.
Written by: Saman Ali
Disclaimer:
This article is for informational and educational purposes only and does not constitute financial, investment, trading, or legal advice. Always do your own research or consult a licensed advisor before making trading decisions.
Q4 2025 Earnings Review: AI Leadership in Tech vs. Structural Headwinds in Energy

Q4 2025 Earnings Review: AI Leadership in Tech vs. Structural Headwinds in Energy
Tech and Energy Earnings Review Q4 2025: An in-depth study of Nvidia, Apple, Microsoft, and energy giants based on data-driven information to guide investors.

Key Insights
- Broad-based earnings strength was achieved through technology companies, which was due to continued AI and cloud investment.
- The outcome of the energy sector showed both positive and negative performance due to decreased crude prices and narrowing of the margins.
- The AI infrastructure investment remained in the process of redefining capital investment in the two sectors.
- Investors in 2026 have to deal with valuation discipline and geopolitical risk management as well.
Introduction:
With the end of Q4 2025 earnings season, investors have a better idea of how the major technology and energy companies have fared in the face of enduring geopolitical tensions, higher interest rates, and structural changes as a result of artificial intelligence.
FactSet reports that earnings of the S&P 500 increased in high single digits on a year-over-year basis. Nonetheless, there was an increase in sector dispersion. Technology was at the forefront, using AI-driven revenues, and energy companies were adapting to fluctuations in prices and regulatory risks.
This review considers the true performance in terms of earnings of the major companies and weighs their strategic impact on long-term investors.
Technology Sector Performance

NVIDIA: Continued Domination in AI Infrastructure.
Financial Highlights (Q4 FY2025):
- Revenue: $57.0B(+78% YoY)
- EPS: $0.89 (+80% YoY)
- Gross Margin: ~73%
- Data Center Revenue: $35.6B
NVIDIA has reported another record quarter, where the hyperscaler market of advanced GPUs and AI systems is in demand. Backlog orders stretched to fiscal 2026, which strengthens the revenue on a long-term basis.
Investment-wise, Nvidia is the fundamental beneficiary of the worldwide adoption of AI, but the sensitivity of valuation has been elevated.
Microsoft: Cloud and Enterprise Stability
Financial Highlights:
- Revenue: $81.3B(+18% YoY)
- EPS: $3.65 (+24% YoY)
- Net Income: $27.2B
- Azure Growth: High-teens %
The Q4 performance of Microsoft was an indication of a high use of cloud and artificial intelligence-based productivity tools by enterprises. Azure was one of the key growth drivers, and Copilot adoption increased ecosystem stickiness.
Microsoft continues to present to its investors a growth, cash-generating, and defensive stability profile.
Apple: Ecosystem Resilience
Financial Highlights:
- Revenue: $143.8B(+8% YoY)
- EPS: $1.85 (+13% YoY)
- Gross Margin: 47.2%
- Services Revenue: All-time high.
The hardware sales of Apple were still not evenly distributed in regions, especially in China. The increase in services and ecosystem monetization, however, counterbalances the cycle of devices.
The performance of Apple confirms the transition towards a recurring-revenue-based model of the business.
Intel: Gradual Recovery Phase
Financial Highlights:
- Revenue: $13.7B (–4% YoY)
- EPS: –$0.06 (GAAP)
- Gross Margin: Moving in the right direction.
- Foundry Investment: Ongoing
Intel went on with its restructuring and manufacturing rearrangement. As much as the profitability is still under pressure, better utilization rates and demand for the AI-server are giving encouragement for stabilization.
Energy Sector Performance

ExxonMobil: Cash Flow Resilience
Financial Highlights:
- Earnings: $6.5B
- EPS: $1.53
- Operating Cash Flow: $12.7B
- Free Cash Flow: $5.6B
Reduced crude prices forced margins down, but restrained capital allocation and efficiency in the upstream saved shareholders' returns.
Chevron: Operational Discipline
Financial Highlights:
- Revenue: $46.9B
- EPS: $1.52
- Cash Flow: $10.8B
The performance of Chevron pointed out the cost efficiency and strength of the balance sheet as a buffer to commodity cycles.
Shell: LNG and Trading Strength
Financial Highlights:
- Adjusted Earnings: $3.3B
- Free Cash Flow: $9.4B
- Buybacks: Continued
The Shell gas and LNG trading business operations were integrated, which added stability even when the refining margin pressure was high.
PetroChina: Policy-Driven Stability
Even though all Q4 2025 data is not available, the recent performance of PetroChina is characterized by:
- 2024 Net Profit: $23B+ (record level)
- Production Growth: +2.5% YoY
- Capital Support by the State.
The national energy administration in China is still focused on national energy security, which upholds the upstream investments and price stability of PetroChina. The volatility of earnings is mitigated by government-supported infrastructure expenditure and long-term contracts on supplies.
To the investors, PetroChina comes with a stability that is backed by policies but with little upside because of the controlled prices.
Earnings Snapshot
|
Company |
Revenue |
EPS |
YoY Trend |
Key Driver |
|
Nvidia |
$57.0B |
$1.30 |
Strong |
AI chips |
|
Microsoft |
$81.3B |
$4.14 (Non-GAAP) / $5.16 (GAAP) |
Strong |
Cloud |
|
Apple |
$143.8B |
$2.84 |
Strong |
iPhone & Services |
|
Intel |
$13.7B |
$0.15 (Non-GAAP) / –$0.12 (GAAP) |
Weak / Improving |
Restructuring |
|
ExxonMobil |
~$82.3B |
$1.53 (GAAP) / $1.71 (Adj.) |
Mixed |
Upstream |
|
Chevron |
$46.9B |
$1.52 |
Stable |
Efficiency |
|
Shell |
$64.1B |
~$1.12 (Adj.) |
Mixed |
LNG |
|
PetroChina |
~719B CNY (~$100B+ USD) |
~0.23 CNY (~$0.03 USD) |
Stable |
Policy Support |
Valuation and Downside Risks
Overvaluation Risk
The stocks of mega-cap technology have higher multiples than the historic average. There are several ways Nvidia and Microsoft are exposed to compression in case AI expenditure levels off.
China Exposure
Apple, Nvidia, and Intel are exposed to demand risk due to the export control and regulatory restrictions on China-related revenues.
Policy and Regulatory Risk
Continued lowering of Brent prices to below $60 may strain the margins of Exxon, Chevron, and Shell companies, especially in downstream operations.
Policy and Regulatory Risk
- AI governance rules
- Antitrust regulation
- Costs of environmental compliance.
- Carbon pricing mechanisms
These are potential limiting factors to long-term profitability.
Investment Implications
Technology
- The structural growth is preserved.
- The AI expenditure is multi-year.
- Importance of valuation discipline.
Preferred exposure: Nvidia, Microsoft, Apple.
Energy
- Pay attention to the durability of cash flow.
- The LNG and the integrated models are favored.
- Critical Dividend Sustainability.
Preferential exposure Shell, ExxonMobil (selective).
Conclusion
Q4 2025 profitability verified a growing performance disparity amid the technology and energy industries. AI-based infrastructure investment remains the driver of the earnings growth of the major tech-oriented companies, with energy companies being limited by pricing and regulation opportunities.
To the investors, there are three themes dominating:
- AI continues to be the main driving force of world profits.
- Diversification and capital restraint are the determinants of energy profitability.
- The valuation risks and geopolitical risks need to be selectively positioned.
Sustainable cash generation and structural growth exposure would continue to be at the center of the long-term returns as markets enter 2026.
Reference Links

Disclaimer:
This article is for informational and educational purposes only and does not constitute financial, investment, trading, or legal advice. Always do your own research or consult a licensed advisor before making trading decisions.
Technical Analysis in Trading: The Map, The Trap, and The Edge

Technical Analysis in Trading: The Map, The Trap, and The Edge
Technical analysis is the most widely used methodology in speculative markets, and ironically, the most widely misunderstood. Traders deploy TA across forex, CFDs, cryptocurrencies, stocks, shares, commodities, and indices believing they are gaining foresight into future price. What they are often gaining instead is pattern recognition bias dressed as analysis, and that bias is the single fastest route to capital destruction. Unlike investing, trading operates in leveraged environments, tight invalidation windows, and rapidly shifting market regimes — meaning TA was never designed to tell you what will happen, but to tell you what is happening, and more importantly, what must not happen for your idea to remain valid. The trader who confuses interpretation with prediction eventually loses everything, not because TA doesn’t work, but because they used it for a purpose it was never meant to serve.
The Anatomy of the Technical Illusion
Retail traders approach charts like historians searching for repetition. They believe if price bounced off a level before, that level now carries an invisible force field into the future. This creates the illusion of control and certainty. The market occasionally rewards this thinking, not because the analysis was correct, but because price simply revisited a liquidity pool that happened to align with a drawn level. The danger lies in the other 90% of the time, when price doesn’t respect those levels at all — it weaponizes them. Markets are engineered around liquidity consumption. Support and resistance are often not barriers, but magnets, used by institutions to trigger stop-loss waterfalls, fill large orders, and reverse price only after retail capital has been harvested. The chart looks predictable in hindsight, but unpredictable in execution, which is exactly how the trap is constructed.
Examples of Static TA Thinking That Would Destroy Traders

1. “Historical Support Always Holds” – The Nasdaq Fallacy
Consider the Nasdaq 100 index — a favorite CFD instrument for global traders. If a trader in 2010 had studied the previous decade of price action, they would have found a clean market structure of swing lows repeatedly defending the 1800–2200 zone. A static-thinking technician would conclude that future pullbacks into this region must present long opportunities. Fast forward to 2020, when the index collapsed from 9700 to 6600 in under one month — ripping through 10 years of historic support. Traders who bought because “support always held in the past” would have endured a 30% loss in weeks on leveraged margin. Many would double down at 7200, believing in mean reversion, only to face further liquidation sweeps before price recovered. Then again in 2022, Nasdaq fell from 16,500 to 10,500, a 36% drop, once more ignoring long-term structure entirely. A trader using high CFD leverage without invalidation logic wouldn’t lose 30% or 50% — they would lose 100%, repeatedly re-entering the same collapsing zones until margin failure. The mistake wasn’t technical analysis — the mistake was believing that TA predicted the future instead of describing the present. TA should have told them: “If price closes below 6600, the long idea is invalid — regardless of history.” But history blinded them, and the market punished them for it.
2. “Resistance = Reversal” – The XAU/USD Trap
Gold (XAU/USD) has been in a powerful macro uptrend over the past 2+ years, making it one of the most attractive CFD instruments for breakout and carry-flow traders. Between 2023 and 2025, price formed extremely visible resistance zones at 1930, 1985, 2050, 2075, 2145, and 2200. Retail traders treated each as a reversal fortress. Every indicator screamed overbought. RSI sat above 70 for weeks at a time. MACD was extended. Commentators called for correction after correction. What actually happened? Gold blew through each resistance zone, sometimes retraced briefly, and then continued trending 400–1200+ pips higher. Traders who sold at resistance without regime awareness experienced a phenomenon that destroys most technicians:
-
Overbought stayed overbought
-
Resistance became support after liquidity sweeps
-
Stop losses were triggered above highs before real reversals
-
Trend continuation made static levels irrelevant
In leveraged CFDs, this behavior would repeatedly liquidate traders selling resistance, even though the analysis looked logical. The market didn’t reverse because resistance was broken — it reversed after liquidity was consumed beyond resistance, once institutions were filled. The professor’s rule applies: “A level is only valid until price behavior invalidates the thesis.” Not a second longer.
3. The “Carry Pair = Safe Support” Catastrophe
Let’s take carry trading favorites like USD/TRY or USD/ZAR, often traded via CFD platforms for swap or trend exploitation. A trader may analyze USD/TRY from 2018 to 2020 and observe repeated price stabilization around 5.80–6.20. Support looks impenetrable. But by 2023 the pair traded above 25.00 — a 300%+ currency devaluation, completely disregarding previous structure. Even if swap was positive, any leveraged trader holding longs at historic support without invalidation rules would be obliterated, because the market shifted regime entirely when inflation dynamics, central bank credibility, and macro volatility altered capital flows. Technical analysis should have told them to adjust SL and trend bias using volatility measures like ATR or momentum filters like ADX, but static level reliance would have wiped them out long before swap accumulation mattered.
4. “Chart Patterns Always Play Out” – The Bitcoin Graveyard
Crypto markets are TA-heavy ecosystems, meaning the trap density is even higher. Between 2021 and 2024, Bitcoin formed dozens of textbook patterns:
-
Double tops at 69,000
-
Head & Shoulders breakdowns
-
Bull flags
-
Falling wedges
-
Ascending triangles
Retail traders treated each as a future guarantee. What did the market do instead? It delivered fakeouts in both directions, sweeping lows to 15,500 in 2022 (-77%), then rallying back to 73,000 in 2024, trapping shorts and longs symmetrically. Traders who believed chart patterns guaranteed price direction were wiped out not by market movement, but by market sequencing — liquidity sweeps first, narrative logic last. The lesson here for all markets is that TA must evolve into a rules-based framework:
“If the pattern fails, the trade fails. If the market regime changes, the strategy changes. If liquidity is taken, wait for confirmation, not nostalgia.”
TA Best Practices That Keep Traders Alive

1. Think in Scenarios, Not Forecasts
Professional traders never conclude with “price will go here.” They conclude with:
-
“If price breaks and closes above this range → continuation likely.”
-
“If price rejects after liquidity sweep → reversal scenario active.”
-
“If volatility expands beyond threshold → reduce size or widen risk logic.”
This keeps ego out of execution and capital alive long enough for probability to matter.
2. Invalidation Is More Important Than Confirmation
Most traders look for confirmation. Professionals look for invalidation first. A good rule:
-
A trend trade is dead when structure breaks against position and holds
-
A range trade is dead when expansion invalidates mean-reversion logic
-
A pattern trade is dead when the pattern fails before RR plays out
TA should protect capital before it attempts to grow it.
3. Use Indicators as Behavioral Filters, Not Directional Oracles
The following indicators are statistically useful when applied correctly:
Trend Identification
-
20/50/200 Moving Averages → directional bias and regime structure
-
ADX → trend strength vs range regime
-
Above 25 = trend confirmation
-
Below 20 = avoid trend strategies
-
Momentum Awareness
-
RSI → only reliable for reversals when market is not trending
-
MACD Histogram → momentum contraction/expansion behavior
Volatility and Risk Distance
-
ATR → SL/TP distance based on true volatility
-
Bollinger Band Squeeze → breakout loading detection, not breakout direction
Volume (Critical for Crypto, Shares, Indices, CFDs)
-
Volume Profile → institutional value zones
-
VWAP → fair-value pricing bias
-
Relative Volume spikes → participation detection
A clean chart with 2–3 behavioral filters outperforms a noisy chart with 10 indicators every time.
TA Conclusion Every Trader Must Internalize
Technical analysis is essential in every speculative market because it reveals participation, structure, momentum, and liquidity faster than any fundamental headline ever will. But the moment a trader believes TA gives them future knowledge, they detach from reality and attach to bias — and the market always punishes that transition. Nasdaq would have destroyed anyone relying on 20-year support lines. Gold would have destroyed anyone selling every resistance tap for 2 years. Bitcoin would have liquidated anyone trusting every textbook pattern without invalidation logic. TA is not the art of being right — it is the art of structuring decisions, defining risk, reading behavior, and executing with discipline in uncertainty.
The future of price is unknown. The risk on your trade should never be. That is the edge.
Disclaimer:
This article is for informational and educational purposes only and does not constitute financial, investment, trading, or legal advice. Always do your own research or consult a licensed advisor before making trading decisions.
Our #1 Trusted Partner - TiBiGLOBE

Q4 2025 Earnings Preview: Tech Growth vs Energy Challenges

What Should Investors Watch in the Q4 2025 Tech and Energy Earnings Season?

Key Insights on the Q4 2025 Earnings Season
- Research suggests tech sector earnings could grow between 13% and 26% year over year. This growth is mainly driven by advances in AI. However, geopolitical tensions could add volatility, especially to global supply chains.
- The energy sector is facing possible revenue declines of around 2%. This pressure comes from lower oil prices and ongoing global crises. At the same time, renewable energy offers support, with some companies reporting double-digit profit growth.
- Gold and silver prices have surged to record levels, near $4,560 and $78 per ounce. This reflects investor concern over rising debt and global conflicts. It may also point to higher inflation, which could pressure both tech and energy sectors.
- Analysts remain cautiously optimistic. AI continues to support tech growth. However, wars and trade disputes are increasing uncertainty. Overall, expectations lean toward moderate growth despite these challenges.
Introduction
As the fourth quarter of 2025 comes to an end, attention is shifting to the earnings season that will begin in January 2026. This period is expected to offer a clear picture of how US and European companies in the tech and energy sectors have performed. It will do so against a complex global backdrop.
Overall, earnings for the S&P 500 are projected to grow by around 8.3% compared to last year. As a result, focus is firmly on tech and energy. These sectors have faced pressure from geopolitical tensions, ongoing wars, the prevailing energy crisis, and soaring gold and silver prices.
According to FactSet data, the tech sector is expected to post strong earnings growth of up to 25.7%. This growth is expected to be mainly driven by continued progress in artificial intelligence, or AI. On the other hand, the energy sector is facing a more challenging period. It is expected to see a modest revenue decline of 1.9%, which might be due to fluctuating oil prices.
This analysis looks at earnings expectations in detail. Additionally, it highlights key companies and reviews analyst views. All insights are based on the latest available data as of late December 2025.
Tech Sector Overview

The tech sector is performing well and is probably the main growth driver. It is because the US technology giants are leading this growth momentum. Nvidia is majorly focused on AI infrastructure. It is expected to report EPS of $1.51, against the $0.89 last year. This strong performance by NVIDIA is a major factor behind the sector’s 17.9% growth in revenue.
Meanwhile, Microsoft and Apple are also expected to deliver solid results. Microsoft’s EPS is projected at $3.91, while Apple’s is anticipated at $2.66. These figures are supported by growing demand for cloud services and continued device sales. Similarly, Amazon and Alphabet, or Google, are projected to post strong numbers as well. Furthermore, across major companies, including Meta, AI-related capital spending is approaching $400 billion.
In Europe, tech momentum is also building. ASML, the Dutch leader in chip-making equipment, continues to benefit from strong global demand for semiconductors. Meanwhile, Germany’s SAP expects nice growth in software revenues. Spotify and Klarna are also in focus. According to Wedbush analyst Dan Ives, these stocks are undervalued opportunities today. Their growth could come from expansion in streaming and fintech. As Ives puts it, “It’s time for Europe to shine in tech amid frustration with valuations.”
Overall, tech earnings are expected to grow between 13% and 26%. This would mark the 10th straight quarter of earnings growth for the sector.
However, geopolitical risks is a major concern for tech sector. The US-China tech conflict has escalated. Export restrictions on advanced chips are speeding up global decoupling. According to BlackRock’s Geopolitical Risk Dashboard, it is ranked as a high-likelihood threat to the market. As a result, supply chains for companies such as Nvidia and ASML could face disruption.
Meanwhile, ongoing wars are also adding pressure. Russia’s invasion of Ukraine and rising tensions in the Middle East are increasing cybersecurity risks. BlackRock warns that large cyberattacks could hit critical infrastructure. It also points out that AI now allows up to 90% of espionage activities to be automated.
These conflicts are also adding into a broader energy crisis. Energy costs are rising. This directly affects data centres, which rely on large amounts of electricity to operate. J.P. Morgan analysts highlight this risk clearly. They state that AI could lead to a tenfold rise in power consumption over the next three years. As a result, profit margins across the tech sector could get affected.
Furthermore, the sharp rise in silver and gold prices is also adding another challenge. As of December 26, 2025, gold reached $4,561 per ounce, while silver climbed to $78. This reflects annual gains of 72% for gold and 154% for silver. These moves are being driven by rising debt concerns and ongoing geopolitical instability.
Recent US strikes in Nigeria and growing pressure on Venezuela have increased global conflict risks. As a result, investors are moving into safe-haven assets. This trend is often described as a “debasement trade.” For the tech sector, this shift signals possible inflation and higher borrowing costs. In turn, this could slow investment in AI.
Goldman Sachs highlights another important point. Valuation gaps between European and US markets are now at their widest levels. Because of this, the firm advises greater diversification. As Nicolas Simar, Co-Head of International Equity Income, explains, “Following the significant rebound in the tech space, we are back to the highest discount in terms of relative valuations for Europe versus the US.”
Energy Sector Outlook

Turning to energy, the outlook is more moderate. In the US, NextEra Energy stands out. It is expected to deliver double-digit profit growth. EPS is forecast at $0.64, up 20.8% from last year. This growth is supported by renewable energy expansion and rising demand from data centres.
In contrast, ExxonMobil and Chevron face more pressure. Oil prices are averaging $59.34, down from $70.09 previously. As a result, sector-wide revenues could come under strain. In Europe, large energy firms are showing mixed performance. TotalEnergies and Shell report uneven results. At the same time, Siemens Energy posted record quarterly revenue above €10 billion. BP and European Energy also reported strong gains in EBITDA. For European Energy, EBITDA rose by €102.5 million to €114.5 million in the first nine months.
Geopolitical developments continue to shape the energy market. The war in Ukraine has led to drone attacks on energy infrastructure, according to BlackRock. This has increased volatility across the sector. Meanwhile, tensions in the Middle East threaten supply stability. The International Energy Agency notes that oil supply appears adequate at $60 to $65 per barrel. However, it also warns of fragility due to concentrated mineral refining.
The energy crisis is being intensified by AI-driven demand. Global investment in data centres reached $580 billion in 2025. J.P. Morgan highlights this trend clearly. It expects power demand growth in the United States to rise by five to seven times over the next three to five years. This shift supports renewable energy growth. At the same time, it puts added strain on existing power grids.
The rise in precious metals reflects these growing risks. Gold is increasingly used as a hedge against rising sovereign debt. In the US, debt is projected to reach 122% of GDP by 2034. Analyst Ed Yardeni warns that “Bond Vigilantes” could push yields higher as deficits expand. This could trigger stock market corrections and affect investment flows into energy.
The International Energy Agency stresses the need for diversification. It expects global LNG supply to rise by 50% by 2030. Around half of this increase is expected to come from the United States.
Looking ahead, the outlook improves in some areas. Analysts at Goldman Sachs expect global growth to re-accelerate in 2026. Europe is likely to benefit from increased fiscal stimulus. J.P. Morgan remains positive on AI. It sees AI as a major boost to productivity. As the firm notes, “The greatest potential boon for global productivity over the coming decade will come from AI, where U.S. companies now enjoy a commanding lead.”
However, risks remain. BlackRock continues to warn about ongoing challenges. Trade protectionism is one of the key risks that could weigh on markets going forward.
Earnings Estimates for Major Companies
|
Sector |
Company (Region) |
Q4 2025 EPS Estimate |
YoY Growth |
Key Driver |
|
Tech |
Nvidia (US) |
$1.51 |
+70% |
AI chips |
|
Tech |
Microsoft (US) |
$3.91 |
+3% |
Cloud/AI |
|
Tech |
Apple (US) |
$2.66 |
+6% |
Devices |
|
Tech |
ASML (Europe) |
N/A |
+15-20% est. |
Semiconductors |
|
Tech |
SAP (Europe) |
N/A |
+10-15% est. |
Software |
|
Energy |
NextEra (US) |
$0.64 |
+21% |
Renewables |
|
Energy |
ExxonMobil (US) |
N/A |
-5% est. |
Oil prices |
|
Energy |
TotalEnergies (Europe) |
N/A |
+2-5% est. |
Diversification |
|
Energy |
Siemens Energy (Europe) |
N/A |
+7% |
Revenue surge |
Geopolitical Risks and Sector Impacts
|
Risk |
Likelihood (BlackRock) |
Tech Impact |
Energy Impact |
|
Middle East War |
High |
Supply chain disruptions |
Energy infrastructure threats |
|
US-China Decoupling |
High |
AI fragmentation |
Rare earth shortages |
|
Russia-NATO Conflict |
Medium |
Cybersecurity risks |
Gas supply volatility |
|
Cyber Attacks |
High |
IP theft |
Grid disruptions |
Conclusion
In summary, the tech sector continues to benefit from strong momentum driven by AI. This creates clear upside potential. At the same time, the energy sector is navigating a difficult transition shaped by ongoing crises. As a result, a more cautious approach is needed.
Goldman Sachs offers a balanced view. It expects global growth to slow toward the end of the year. However, it also sees growth picking up again in 2026. Given this outlook, investors should closely watch how these connected forces evolve across both sectors.
Reference Links
- Q4 Earnings: Tech Expected to Remain Growth Driver
- Dan Ives loves these 4 European tech companies
- FactSet Earnings Insight
- NextEra Energy's Q4 2025 Earnings: What to Expect
- Tech war 2.0: The dangers of Trump's 'G2' bargaining
- Silver prices continue soaring
- Market Know-How 4Q 2025
- FactSet Earnings Insight (Browse)
- Outlook 2025 Building on Strength
- World Energy Outlook 2025
- Geopolitical Risk Dashboard
- Silver prices continue soaring (Browse)
- Quarterly market outlook — Fourth quarter 2025
- Earnings Release Q4 FY 2025
- European Energy sticks to lower end of 2025 EBITDA guidance
Disclaimer:
This article is for informational and educational purposes only and does not constitute financial, investment, trading, or legal advice. Always do your own research or consult a licensed advisor before making trading decisions.
TiBiGLOBE: A Brokerage Built on Structure, Education, and Long-Term Vision

TiBiGLOBE: A Brokerage Built on Structure, Education, and Long-Term Vision
By the AllFXBrokers Team
Industry Feature | 2025
In an era where the global forex and CFD industry continues to mature under tighter regulation and heightened scrutiny, brokerage firms are increasingly being judged not by scale alone, but by structure, transparency, and long-term intent. Against this backdrop, TibiGlobe has emerged as a young but steadily growing brokerage brand, positioning itself around regulation, trader education, and partner-focused growth.
Founded in 2023, TibiGlobe represents a new generation of brokers aiming to balance competitive trading conditions with a more responsible, sustainable operating model—one that appeals equally to retail traders and professional industry partners.

A Deliberate Approach in a Fast-Moving Industry
Unlike many market entrants that prioritize rapid client acquisition, TibiGlobe’s development has followed a more measured trajectory. From its earliest stages, the company focused on establishing regulatory foundations, operational infrastructure, and a clear market identity before pursuing expansion.
This approach reflects a broader shift within the brokerage industry, where credibility and compliance have become as important as pricing and technology.
“Our focus from day one was not speed, but structure,” says Marinos Vassiliou, Chief Executive Officer of TibiGlobe.
“We wanted to build a brokerage that could grow without compromising regulatory discipline or trader trust.”
Leadership Shaping the Company’s Direction
TibiGlobe is led by a management team with experience across brokerage operations, partnerships, and financial services.
At the helm is Marinos Vassiliou, whose role as CEO spans strategic planning, regulatory alignment, and international development. His leadership philosophy emphasizes clarity—both internally and externally—particularly in an industry where complexity often works against retail traders.
Working alongside him is Eleni Nicolaou, responsible for partnerships and strategic development. Her focus has been on creating collaboration models that support long-term value creation rather than short-term performance metrics.

“Strong partnerships are built when expectations are clear on both sides,” Eleni Nicolaou explains.
“Our goal has been to work with partners who are aligned with sustainable growth, not quick wins.”
Regulatory Framework and Corporate Structure

Regulation remains a central pillar of TibiGlobe’s business model.
The broker operates through a multi-jurisdictional structure, including:
-
South Africa, where it is authorized and regulated by the Financial Sector Conduct Authority (FSCA)
-
Mauritius, where it holds an Investment Dealer licence issued by the Financial Services Commission (FSC)
This framework enables TibiGlobe to service international clients while maintaining oversight from recognized regulatory bodies. As with all multi-entity brokers, traders are advised to confirm the specific legal entity under which their account is opened and to review the relevant legal documentation.
Market Access and Product Offering
TibiGlobe offers CFD trading across a broad range of asset classes, designed to support diversified trading strategies within a single environment. These include:
-
Forex (major, minor, and selected exotic pairs)
-
Global indices
-
Precious metals
-
Energy products
-
Stocks (CFDs)
-
Cryptocurrencies (CFDs)
The broker’s product lineup reflects the expectations of modern retail traders, many of whom seek exposure to multiple markets without the operational friction of maintaining accounts with multiple providers.
Technology and Trading Platforms

At the core of TibiGlobe’s trading infrastructure is MetaTrader 5 (MT5)—a platform widely adopted across the global brokerage industry.
MT5 provides traders with:
-
Advanced charting and analytical tools
-
Support for algorithmic and automated strategies
-
Multiple order types and execution modes
-
Access across desktop, web, and mobile devices
In addition, TibiGlobe has integrated social trading functionality, responding to growing demand for community-driven and strategy-sharing environments, particularly among newer market participants.
“Technology should support traders, not overwhelm them,” notes Marinos Vassiliou.
“Our platform choices are guided by usability and reliability, not novelty.”
Leverage, Account Structure, and Trading Conditions
Depending on jurisdiction and regulatory limitations, TibiGlobe offers competitive leverage levels in line with industry norms.
The broker also provides:
-
Multiple account configurations
-
Swap-free trading options, subject to specific terms
-
Flexible trading conditions designed to accommodate different experience levels

As always, leveraged trading involves significant risk, and traders are encouraged to understand how leverage impacts both potential returns and losses.
Education as a Strategic Pillar

One area where TibiGlobe has invested consistently is trader education.
Rather than treating education as a secondary feature, the broker has positioned learning resources as an integral part of its offering. Through its educational initiatives, traders gain access to:
-
Market fundamentals
-
Platform tutorials
-
Trading concepts and risk-awareness content
This emphasis reflects a growing recognition within the industry that informed traders tend to trade more responsibly—and remain engaged over the long term.
“Education isn’t just a value-add,” says Eleni Nicolaou.
“It’s a responsibility. Well-informed traders make better decisions, and that benefits the entire ecosystem.”
A Partner-Centric Brokerage Model

From an industry perspective, TibiGlobe has gained attention for its partner-oriented approach.
The broker offers:
-
Transparent partnership structures
-
Competitive commercial terms
-
Dedicated partner support
-
A long-term collaboration mindset
This approach has positioned TibiGlobe among brokers offering one of the more competitive partner propositions in the global forex industry, attracting affiliates, introducing brokers, and media platforms seeking stable, long-term relationships.
It is this alignment that led AllFXBrokers.com to appoint TibiGlobe as its #1 Trusted Partner.
Growth Trajectory and Market Positioning
Although still a relatively young brand, TibiGlobe has demonstrated steady expansion in visibility, partnerships, and operational scope.
By continuing to invest in:
-
Regulatory alignment
-
Platform stability
-
Educational development
-
Strategic partnerships
the broker appears well-positioned to strengthen its role within an increasingly competitive and regulated global trading environment.
Editorial Perspective
TibiGlobe’s development reflects a broader evolution within the brokerage industry—one where long-term credibility, transparency, and education increasingly define success.
While traders should always conduct independent due diligence and fully understand the risks associated with CFD trading, TibiGlobe stands out as a brokerage focused on building lasting value, rather than short-lived momentum.
Editor’s Note
TibiGlobe holds the #1 Trusted Partner position on AllFXBrokers.com. This article is intended for informational and editorial purposes and does not constitute financial advice.
Risk Warning: Contracts for Difference (CFDs) are complex financial instruments and may not be suitable for all investors. Trading CFDs involves substantial risks of losing your invested capital. It’s important to note that CFDs are a leveraged product, which means they can magnify both potential gains and losses. It’s crucial to understand that CFD traders do not possess ownership or rights to the underlying assets.
Disclaimer:
This article is for informational and educational purposes only and does not constitute financial, investment, trading, or legal advice. Always do your own research or consult a licensed advisor before making trading decisions.
Gold, Silver & WTI: Macro Drivers, Geopolitics and Trading Playbook (2025 Outlook)

Gold, Silver & WTI: Macro Drivers, Geopolitics and Trading Playbook (2025 Outlook)
1. Executive Summary
Over the past few years, gold, silver and U.S. crude oil (WTI) have traded through one of the most volatile macro regimes in decades: a pandemic shock, aggressive monetary tightening, persistent inflation, and overlapping wars.
-
Gold has surged to around $4,100–4,200/oz, more than doubling from pre-pandemic levels, lifting its estimated market capitalization to roughly $30 trillion in 2025.
-
Silver has outperformed gold in percentage terms, climbing from about $20/oz in late 2023 to above $50/oz in late 2025, driven by industrial demand (especially solar) and a structural supply deficit.
-
WTI crude oil is currently trading just below $60/barrel, down from its post-pandemic spikes above $100, as supply growth and the prospect of peace in Ukraine weigh on prices.
For online traders, these three markets offer a powerful mix of liquidity, volatility and macro sensitivity. But they are also heavily driven by world economic data, geopolitics, wars, and central banks, and must be approached with a clear framework.
2. How We Got Here: 2020–2025 in a Nutshell
Pandemic, Money Printing and Inflation
From 2020 onwards, global markets went through three distinct phases:
-
Shock (2020) – COVID-19 crushed demand, sending WTI briefly negative on futures expiry and driving an historic collapse in oil prices, while gold and silver initially sold off in the global liquidity scramble.
-
Liquidity Wave (2020–2021) – Massive fiscal stimulus and ultra-low interest rates pushed real yields deeply negative. Gold and silver rallied as “monetary assets”, while oil rebounded as demand slowly normalised.
-
Inflation & Rate Hikes (2021–2023) – Inflation surged to multi-decade highs in many economies. Central banks, led by the Fed, embarked on the most aggressive hiking cycle since the 1980s. Real yields rose, temporarily capping gold and silver, but energy markets stayed volatile due to supply constraints and war.
Wars and Geopolitics
Two major shocks reshaped commodities:
-
Russia–Ukraine war (from 2022):
-
Tightened energy markets via sanctions and supply disruptions, pushing oil and gas sharply higher initially.
-
Raised risk premia across safe-haven assets, including gold.
-
-
Broader Middle East tensions and proxy conflicts:
-
Periodically boosted oil risk premiums and safe-haven flows into gold.
-
Increased demand for “crisis hedges” among institutional and retail traders.
-
By late 2025, markets are transitioning into a phase where growth is slowing, inflation remains above central bank targets, and traders are increasingly pricing future rate cuts, a combination that tends to favour precious metals while limiting upside in oil if supply remains ample.
3. How Economic News and Geopolitics Move Gold, Silver and Oil
3.1 Interest Rates, Real Yields and the U.S. Dollar
The single most important macro driver for gold and silver is the interaction between:
-
Nominal yields (e.g. U.S. 10-year Treasury);
-
Inflation expectations;
-
The U.S. dollar (DXY).
Higher real yields and a stronger USD usually weigh on gold and silver, as the opportunity cost of holding non-yielding metals rises. Conversely, when markets price rate cuts or expect inflation to stay sticky, real yields fall and precious metals typically gain.
WTI is also sensitive to the dollar (a stronger USD tends to pressure commodities priced in dollars), but demand growth, inventories and OPEC+ policy usually dominate.
3.2 Growth Data and Inflation Releases
Key data releases that move XAUUSD, XAGUSD and USOIL CFDs include:
-
U.S. CPI & PCE inflation – surprise upside boosts inflation hedging demand for gold/silver; downside surprises can hurt them if they imply more dovish inflation risk.
-
Non-Farm Payrolls (NFP) and unemployment – strong labour data can lift yields and the dollar, often pressuring precious metals and supporting oil via growth expectations.
-
PMIs / ISM data – indicate manufacturing and services momentum, impacting industrial demand for silver and fuel demand for oil.
3.3 Wars, Sanctions and OPEC+
Geopolitics channels into prices via:
-
Actual supply disruptions: pipelines, shipping routes, sanctions, OPEC+ cuts/boosts.
-
Risk premia: even without physical disruption, traders price in the probability of escalation.
For oil, OPEC+ meetings, announcements on quotas and unplanned outages are core catalysts. For gold and silver, headline risk around escalation, sanctions or financial instability tends to drive short-term spikes as traders rush into safe-haven trades.
4. Gold: The Monetary Metal and Crisis Asset
4.1 Price Performance and Market Size
-
Spot gold is trading around $4,100–4,200/oz in late November 2025, near record highs.
-
Over the last decade, gold has more than tripled in many major currencies.
-
Estimated market capitalization of above-ground gold is roughly $29–30 trillion, dwarfing individual equities and even Bitcoin.
This scale matters: gold is effectively a parallel monetary system. Central banks, sovereign funds, hedge funds and retail investors all participate, making gold one of the deepest and most liquid markets online traders can access through XAUUSD CFDs, spot and futures.

4.2 Why Gold Prices Have Risen
Key reasons behind gold’s multi-year bull trend:
-
Negative real yields through much of 2020–2022.
-
Central-bank buying – many EM central banks increased gold holdings to diversify away from the U.S. dollar.
-
Inflation and fiscal dominance fears – ballooning government debt and concerns about long-term currency debasement.
-
Geopolitical fragmentation – sanctions and financial de-risking have made gold more attractive as an asset outside the dollar system.
4.3 What Traders Should Watch for Gold
Key drivers for XAUUSD:
-
U.S. real yields (10-year TIPS) – downtrend is bullish; a sharp spike higher is a clear warning sign for longs.
-
DXY – a structurally weaker dollar supports the gold bull case.
-
Central bank communication (FOMC, ECB, BoE, etc.) – dovish pivots usually support gold.
-
Systemic risk headlines – banking stress, sovereign debt issues, war escalation.
5. Silver: The Hybrid Metal – Monetary Plus Industrial
5.1 Performance and Market Size
-
Silver is trading in the low-to-mid $50s/oz in late November 2025, having risen around 160% from about $20.7 in October 2023 at its recent peak.
-
Its market capitalization is estimated just above $3 trillion, an order of magnitude smaller than gold, which helps explain silver’s higher volatility.

5.2 Structural Supply Deficit and Solar Boom
Silver’s rally is not only about monetary hedging:
-
Industrial demand – particularly from solar PV, electronics and EVs – has surged. Solar alone accounted for nearly a quarter of silver’s industrial demand in 2024, up sharply since 2020.
-
Persistent supply deficits – several recent market studies project continued silver market deficits, with 2025 expected to mark the fifth consecutive year of significant shortfalls.
At the same time, silver is largely mined as a by-product of other metals, making supply less responsive to price spikes.
5.3 What Traders Should Watch for Silver
For XAGUSD traders, silver is a high-beta play on:
-
All the monetary drivers of gold (real yields, USD, inflation expectations);
-
Plus industrial cycle indicators – global manufacturing PMIs, semiconductor cycles, and solar installation forecasts.
Because of its smaller market cap and industrial component, silver often outperforms gold in bull markets and underperforms in sharp risk-off shocks. That makes it attractive for short-term momentum traders but dangerous for over-leveraged positions.
6. WTI Crude Oil: The Macro Growth and Geopolitics Barometer
6.1 Price Context
-
WTI is hovering around $58–59/barrel in late November 2025, after a multi-month decline driven by rising supply and easing risk premia
-
Major banks (e.g. JPMorgan) now project mid-$50s WTI by 2027, highlighting a base case of balanced but well-supplied markets

6.2 Key Drivers
-
Global demand – tied to GDP growth, particularly in the U.S., China and emerging Asia.
-
Supply from OPEC+ and U.S. shale – production cuts or increases, reserve policy, capital discipline.
-
Wars and sanctions – Russia, Middle East, shipping disruptions (e.g. Straits, canals).
-
Energy transition – long-term headwind on demand growth, but also under-investment in fossil fuels can create supply squeezes in the medium term.
For CFD traders in USOIL/WTI, this market is ultra-liquid, with deep futures volume on CME and ICE, making it ideal for short-term trading but also very sensitive to intraday headlines.
7. How These Markets Tie Into Inflation
-
Energy is a direct input into CPI via fuel, transport and production costs. Spikes in WTI quickly feed through to headline inflation.
-
Gold and silver act primarily as inflation hedges via expectations:
-
When investors believe inflation will remain above target or that central banks are behind the curve, they move into precious metals.
-
When inflation appears tamed and central banks are credible, demand for hedges can fade.
-
In the last few years, both actual inflation and inflation uncertainty have risen. That’s why we’ve seen a regime where energy shocks and monetary expansion reinforced each other, supporting both gold/silver and oil at various points.
8. Forward-Looking Price Zones and Scenarios
(Not investment advice – indicative ranges for scenario planning.)
Given current macro conditions (late 2025), traders are broadly focused on these zones for the next 6–18 months:
8.1 Gold (XAUUSD)
With spot near $4,100–4,200/oz and a recent peak around $4,380, traders watch:
-
Bullish extension:
-
Break and weekly close above $4,400–4,500 could open $4,800–5,000 as an extended target if real yields fall and rate cuts accelerate.
-
-
Base case range:
-
Consolidation between $3,600 and $4,400 as markets transition into a slower-growth, lower-rate regime.
-
-
Bearish scenario:
-
A strong disinflation surprise plus higher real yields could drag gold towards $3,200–3,400, where long-term trend support likely attracts large buyers.
-
8.2 Silver (XAGUSD)
With silver around $50–54/oz after a parabolic move:
-
Bullish extension:
-
A sustained break above the recent peak (~$54+) could target $60–65, especially if solar demand accelerates and deficits deepen.
-
-
Base case:
-
A volatile trading range between $40 and $55, with sharp swings around data and risk sentiment.
-
-
Bearish scenario:
-
A cyclical slowdown in industry and a broad risk-off could push silver back towards $35–38, or even the high-20s in an extreme liquidity shock.
-
8.3 WTI Crude Oil (USOIL)
With WTI near $58–59 and forecasts clustering around the mid-50s long term:
-
Bullish extension:
-
Renewed supply shocks (war escalation, OPEC+ cuts, sanctions) could push WTI into a $75–85 band.
-
-
Base case:
-
A broad $50–70 range, as non-OPEC supply growth and moderate global demand keep the market balanced.
-
-
Bearish scenario:
-
A hard global landing and/or peace-driven surge in Russian exports could force oil into the $40–50 range.
-
These are scenario-based levels, not guarantees. They give online traders reference zones for building trade ideas and risk/reward profiles.
9. Why Traders Should Trade These Markets (Online/CFD Context)
From an online trading perspective, XAUUSD, XAGUSD and USOIL offer:
-
High liquidity & tight spreads – ideal for intraday and swing strategies.
-
Clear macro narratives – easier to anchor trade ideas to economic releases and geopolitical events.
-
Diversification – they behave differently from major FX pairs or indices, especially during crises.
-
Hedging – portfolio managers and active traders can hedge equity or currency exposure via metals and energy.
For your audience (retail CFD and spot traders), the attraction is that all three can be traded long or short with leverage, around the clock, from a single trading platform. The risk, of course, is that leverage magnifies both gains and losses.

10. When to Enter: Practical Trading Approaches
10.1 Trend-Following with Pullbacks
-
Identify the dominant trend on daily/weekly charts:
-
Gold and silver are currently in structural uptrends.
-
WTI is in a medium-term downtrend / wide range.
-
-
Use pullbacks to key moving averages or prior breakout zones (e.g. 50/100-day MA, previous highs/lows) to time entries in the direction of the trend.
-
Combine with momentum indicators (RSI/MACD) to avoid chasing overextended moves.
10.2 Event-Driven Trading Around News
Some traders specialise in trading CPI, NFP, FOMC and OPEC meetings:
-
Before the event: volatility premium rises, spreads may widen; position sizes should be reduced.
-
After the event: if price action confirms the macro signal (e.g. dovish Fed + gold breakout), traders can enter with tighter invalidation levels.
10.3 Mean-Reversion at Extremes
Because metals and oil often overshoot:
-
Watch for false breakouts (break above resistance that quickly reverses) with high volume.
-
Use oscillators and positioning data (COT reports, futures positioning) to identify crowded trades.
This is particularly relevant for silver, which frequently overshoots gold’s move in both directions.
11. What Traders Should Be Paying Attention To (Checklist)
For a practical “trader’s dashboard”:
Macro & Central Banks
-
Fed rate decisions, dot plots and press conferences
-
U.S. CPI, PCE, NFP, ISM/PMI
-
ECB, BoE, BoJ policy shifts
Market Indicators
-
U.S. 10-year yield and real (TIPS) yield
-
DXY (U.S. dollar index)
-
Gold–Silver ratio (risk sentiment within metals)
Geopolitics & Energy
-
Russia–Ukraine peace negotiations, sanctions updates
-
Middle East headlines and shipping disruptions
-
OPEC+ meetings and quota announcements
Sector-Specific
-
For gold: central-bank gold purchases, ETF flows
-
For silver: solar/green energy policy, industrial demand forecasts, supply deficit reports
-
For oil: U.S. inventory data (EIA), rig counts, Chinese demand data
Risk Management (especially for CFDs)
-
Use stop-losses beyond obvious intraday noise.
-
Scale position size to volatility: silver and USOIL often justify smaller sizes than XAUUSD.
-
Avoid being over-leveraged going into tier-1 data releases.
12. Final Thoughts
Gold, silver and WTI sit at the intersection of macro, geopolitics and market psychology. Over the last few years, they’ve responded aggressively to money printing, inflation, wars and shifting expectations about growth and interest rates.
For online traders, these instruments are not just “charts to trade” but expressions of big global narratives. The edge comes from:
-
Understanding which narrative is currently in control;
-
Aligning your trades with that narrative;
-
Managing leverage and risk with discipline.
Disclaimer:
This article is for informational and educational purposes only and does not constitute financial, investment, trading, or legal advice. Always do your own research or consult a licensed advisor before making trading decisions.
Fiscal vs Monetary Policy: What Every Forex Trader Needs to Understand (But Most Don’t)

Fiscal vs Monetary Policy: What Every Forex Trader Needs to Understand (But Most Don’t)
Imagine you're trying to sail across a wide, unpredictable ocean — that ocean is the forex market. Now imagine there are two giant forces controlling the wind and the tides: fiscal policy and monetary policy. These two economic engines are constantly at play, pushing and pulling the value of currencies around the world. Understanding how they operate — and how they affect one another — can be the edge that transforms your trading approach from reactive to strategic.
Too often, traders focus only on charts, indicators, and candle patterns. But the truth is, the biggest currency moves come not from price action alone, but from the decisions made in boardrooms and parliaments — the decisions that shape monetary and fiscal frameworks. Mastering these macro forces is what separates seasoned forex pros from the masses.
The Basics: Two Sides of the Same Coin?
At first glance, fiscal and monetary policies might seem like cousins in economics, but their roles and impacts are distinctly different.
Fiscal policy is the domain of governments. Think of it as the nation’s spending and taxation blueprint. When a government wants to stimulate economic growth, it can cut taxes or increase public spending — funding infrastructure projects, health care, education, and more. The idea is to inject demand directly into the economy.
Monetary policy, however, belongs to the central banks — like the Federal Reserve in the U.S., the ECB in Europe, or the BOJ in Japan. Their toolkit includes setting interest rates, regulating money supply, and engaging in quantitative easing or tightening. They don’t spend money; they manage the cost and availability of money.
Both aim to guide economic stability, but through entirely different levers — and their timing, magnitude, and political motivations often diverge.

The Trader’s View: Why Should You Care?
Understanding these policies isn’t just for economists in ivory towers. For traders, especially in the forex and CFD markets, policy shifts are often the earliest indicators of currency trends.
Take the U.S. in 2020–2021. The government unleashed trillions in stimulus checks, unemployment benefits, and PPP loans. This massive fiscal injection initially weakened the dollar, as traders anticipated inflation, deficit growth, and oversupply of money.
But in 2022, the Federal Reserve flipped the switch, launching one of the fastest interest rate hiking cycles in decades — a monetary counterbalance. Suddenly, the USD surged as yields rose and capital sought higher returns.
The takeaway? Traders who grasped the timing and trajectory of these policies caught the biggest USD trends in years — particularly in pairs like USD/JPY and EUR/USD.

Fiscal Policy in Action: The Politician’s Toolbox
Let’s dive deeper. When economies slow down, governments have two main tools to respond: increase spending or cut taxes. This is fiscal expansion. It boosts consumption and investment by putting more money into people’s pockets or creating jobs through public projects.
But fiscal policy isn’t always market-friendly. Large deficits can spook investors. If a country borrows heavily to fund spending, bond markets may demand higher yields, and the currency could suffer due to debt sustainability concerns.
That said, short-term currency reactions can be bullish. For example, if fiscal stimulus is expected to lift GDP growth significantly, foreign investors may pour into that country’s assets, buying the currency.
This dual-edged nature of fiscal policy is why it’s so important for traders to track not only what’s announced, but how markets interpret it.

Monetary Policy: The Quiet Giant That Moves the World
Monetary policy often seems less dramatic than government spending packages, but its impact is enormous — especially in forex.
When a central bank raises interest rates, it essentially increases the reward for holding that currency. Traders and institutions flock to higher yields, causing demand (and the currency) to rise. Conversely, rate cuts or quantitative easing flood markets with liquidity, often weakening the currency as money supply increases.
But context is everything. A rate hike during a recession may backfire. A dovish policy amid booming inflation might destroy credibility. Market reactions depend on the alignment between policy moves and economic reality.
As traders, you need to go beyond the headlines. Read between the lines of central bank statements, watch the inflation reports, and — crucially — understand how forward guidance shapes future expectations.

When Fiscal and Monetary Collide (or Align)
This is where the fireworks really begin.
When fiscal and monetary policy align, currencies can enter powerful trends. Think of it like a car with both the accelerator (government spending) and turbo boost (rate hikes) engaged at the same time. That economy — and its currency — might roar ahead.
But when they conflict, chaos often follows. For instance, if a government spends big but the central bank keeps rates low or refuses to tighten, markets may fear overheating or policy mismanagement. This often triggers selloffs in the currency, especially if inflation is running hot.
In the forex world, policy divergence between countries is gold. If the Fed is hawkish while the ECB stays dovish, the USD typically strengthens against the euro. These are the kinds of macro conditions that create long-lasting swing trade opportunities.

Key Indicators to Watch
Being a macro-aware trader means tracking the right signals. These are the key indicators that give you early clues:
-
Central bank statements and minutes (FOMC, ECB, BOE, BOJ)
-
Government budget announcements
-
Inflation data: CPI, Core PCE, and producer prices
-
Employment reports: Non-farm payrolls, unemployment claims
-
Bond yields and credit spreads: Especially 2-year and 10-year bonds
By following these, you’ll spot the policy narrative before it shows up on the chart.

Final Thoughts: Be the Trader Who Sees the Whole Chessboard
Trading forex without understanding fiscal and monetary policy is like boxing with one eye closed. You might land a punch, but you'll never see the knockout coming.
As a trader, your job is not just to react, but to anticipate. Watch what policymakers say — and more importantly — what they actually do. Look for policy alignment, divergence, credibility, and momentum. These are your edge in a market driven by headlines, hype, and global capital flows.
So the next time your technical setup lines up, pause and ask: What’s the macro backdrop? That single habit could be the secret weapon that turns your trading from random to razor-sharp.

Disclaimer:
This article is for informational and educational purposes only and does not constitute financial, investment, trading, or legal advice. Always do your own research or consult a licensed advisor before making trading decisions.


