

Displaying items by tag: cryptotrading
What Caused the 2026 Crypto Crash? A Complete Breakdown

What Caused the 2026 Crypto Crash? A Complete Breakdown
The first quarter of 2026 has provided a rude awakening for the cryptocurrency market. After a historic closing to 2025, with Bitcoin (BTC) hitting a new all-time high of $126,000, the excitement quickly turned to despair. Instead of the rally continuing, the market has gone into a sharp correction, which has now lasted for nearly two months.
The correction started in mid-January 2026. To begin with, Bitcoin started the year trading at around $91,000. However, with persistent selling pressure, the price continued to fall over the course of weeks. Mid-March 2026 saw Bitcoin fall to a price range of $69,000 to $70,000. This represents a fall of nearly 50% from its all-time high.
The correction has seen a fall of over $2 trillion from the total crypto market capitalization from its peak in 2025. While the fall for Bitcoin has been sharp, other cryptocurrencies have fallen even further. Several major cryptocurrencies have fallen by as much as 70%. Among these, one of the worst-hit coins has been Solana (SOL). Ethereum too has fallen by over 60%.
The sentiment too has turned extremely negative:
- The Crypto Fear & Greed Index has fallen to extreme fear levels near 15.
- Bitcoin has broken through key technical levels, such as its 365-day moving average.

The key difference between the current correction and previous corrections for the cryptocurrency market is that it has not been caused by a single event such as the collapse of FTX or the collapse of Terra (LUNA). Instead, the correction has come due to a number of structural factors and events happening concurrently.
In short, the 2026 crash was a combination of long-term structural issues and short-term market shocks that pushed the sentiment of the entire crypto market into extreme fear.
In order to understand what really happened, the causes that led to the 2026 Crypto Crash can be broadly categorized into two types:
|
Category |
Description |
|
Long-term Factors |
Structural changes in the economy, geopolitics, and technology that gradually weakened the market |
|
Short-term shocks |
Sudden events that triggered sharp price drops and panic selling |
Part I: Long-Term Factors That Weakened the Market
The stage for the 2026 Crypto Crash was set over a period of time. There were a number of significant macroeconomic, geopolitical, and technological shifts that took place, and this forced investors to reassess the risks of investing in a crypto investment.
The long-term pressures gradually weakened the market before the selling began.
1. Geopolitical Escalation and the Safe-Haven Debate
One of the key contributor of crypto market crash was the rise of geopolitical escalations in the name of US-Iran-Israel War.
In the last days of February, a military operation named Operation Epic Fury escalated the level of tensions in the Middle East, which are still happening. This, in turn, heightened the oil prices and inflation concerns in the global financial market.
In the past, the global financial market has been concerned about the fact that Bitcoin could potentially act as a safe haven in the event of global crises and risk-off sentiment. However, as was seen in the early days of 2026, this is no longer the case.
When the level of geopolitical escalations rose, there was no significant amount of capital entering the Bitcoin market as a safe haven asset. Instead, capital was entering safer assets such as:
- Physical Gold
- The United States Dollar
- Government Bonds
2. Interest Rate and Federal Reserve Policy
It was expected at the beginning of 2026 that the U.S. Central Bank would soon reduce interest rates. Lower interest rates are always a good sign for the financial markets. They make riskier investments more attractive to investors.
However, the situation changed in the last week of January 2026. The U.S. government announced that Kevin Warsh would be the next chairman of the U.S. Federal Reserve. Kevin Warsh was considered as an inflation hawk. This means that he believed that the U.S. needs to maintain high interest rates in order to curb inflation. However, he is now seem to be advocating for lower interest rates amid the ongoing geopolitical issues.
In addition, the latest inflation statistics showed that the U.S. Core Consumer Price Index remained at 2.8%. This meant that the U.S. was still not seeing the drop in inflation that it wanted.
The market suddenly changed at the time of his nomination by Trump. Investors started anticipating that the U.S. will not quickly reduce interest rates, as they had been expecting.
Which in return caused institutional and retail investors to start shifting their investments from volatile markets such as cryptocurrencies. Hence, adding pressure on crypto market sentiment.
3. Quantum Security and Privacy Concerns
At the same time, a relatively unknown issue began to impact cryptocurrency markets.
In March 2026, a Bitcoin Improvement Proposal dubbed BIP-360 was implemented into the network. This proposal is aimed at creating a quantum-resistant cryptographic system for Bitcoin addresses.
While this proposal is aimed at further securing the Bitcoin network in the future, it does highlight a concerning fact: approximately 34% of the total existing Bitcoin supply currently resides in a potentially vulnerable address format.
This concern stems from a strategy dubbed “Harvest Now, Decrypt Later.”
In short, a nation-state could potentially harvest encrypted blockchain data in the present, with the intention of decrypting it in the future when quantum computing is more advanced.
Although this risk is still largely theoretical, it sparked a debate that led to a broad discussion on future blockchain security. And this could also be a factor that triggered a "migration panic." Long-term whales began offloading older "Legacy" and "Taproot" holdings to avoid the complexity of migrating to new P2MR (Pay-to-Merkle-Root) addresses, causing additional pressure on already declining market.
4. Spillover from Tech Markets and Corporate Bitcoin Selling
The macroeconomic and geopolitical pressures also resulted in several secondary effects on other markets.
AI Market Spillover
Many of the larger hedge funds classify cryptocurrency markets alongside AI technology stocks under the category of high-risk investments.
When technology stocks, including Nvidia, saw a correction in late January, these hedge funds were obliged to sell some of their cryptocurrency holdings in order to balance their portfolios.
This resulted in a contagion effect that saw cryptocurrency markets fall alongside technology stocks. Meanwhile, the ongoing war has added into the tech stocks correction, which might be still exerting pressure on crypto market.
Corporate Bitcoin Selling
The other major pressure that cryptocurrency markets are experiencing is coming from companies that have invested in Bitcoin.
Many of the publicly traded cryptocurrency mining companies accumulated large reserves of Bitcoin during the bull market.
However, as noted by Wintermute in their report, this cycle left miners with high debt obligations often pegged against their cryptocurrency reserves.
When Bitcoin dipped below $70,000 during the crash, these companies violated some of these covenants. Meaning, these companies had to maintain a certain value for their assets in order for them to borrow money.
To appease auditors and creditors, they were compelled to liquidate some of their Bitcoin reserves—at a loss. This essentially transformed the long-term holders of the asset, commonly referred to as “diamond hands,” into sellers and added in the market pressure.
Key Causes of the 2026 Crypto Crash
|
Category |
Factor |
Impact on the Market |
|
Macroeconomic |
Federal Reserve interest rate outlook |
Higher-for-longer rates reduced demand for risk assets like crypto |
|
Geopolitical |
Middle East tensions (Operation Epic Fury) |
Investors shifted funds to safer assets such as gold and government bonds |
|
Technological |
Quantum security concerns (BIP-360) |
Raised debate about long-term blockchain security |
|
Market correlation |
Tech and AI stock correction |
Hedge funds sold crypto alongside high-risk tech assets |
|
Corporate pressure |
Bitcoin selling by mining companies |
Debt covenants forced miners to liquidate BTC holdings |
Part II: Short-Term Events That Intensified the Crash
While the aforementioned structural issues may have eroded the market over time, there were a number of short events that hastened the decline. These shocks triggered the price declines.
1. The Trump Tariff Announcement
The first and important shock that came in later February was when the U.S. government announced a 15% universal global tariff.
Tariffs are essentially taxes on imported goods. When tariffs are increased, the price of those goods goes up. This can trigger inflation.
The moment the U.S. announced the tariff, the markets immediately began to reevaluate their assumptions on the likely response of the central banks.
If tariffs trigger inflation, the central banks are less likely to reduce interest rates.
This triggered a rapid decline. Over the course of a single weekend, the price of Bitcoin fell from $74,000 to below $65,000 as global trade concerns escalated.
2. The 20-Millionth Bitcoin Milestone
On March 9th, the Bitcoin network reached a significant milestone. The 20-millionth Bitcoin was mined.
In the long term, the mining of the 20-millionth Bitcoin is a positive event. This is because the overall supply of Bitcoin is capped at 21 million.
The problem lies in the markets. Markets do not always respond well to widely anticipated news.
Prior to the event occurring on March 9, many traders had accumulated Bitcoin anticipating the event. Once the event came closer, they immediately began to sell.
This is commonly known as “sell the news.”
This caused a series of minor declines over the next few days.
3. Jane Street Market Manipulation Allegations
Another factor that contributed to the lack of confidence within the market was the allegations made against Jane Street, a large quantitative trading firm with a significant presence within the crypto ETF market.
There were rumors, as well as potential legal action, that the firm was engaging in the manipulation of spot Bitcoin prices during the U.S. market open for the purpose of benefiting specific trading strategies.
Although these are only accusations, the fact that the rumor was spreading was enough to contribute to the lack of confidence within the market.
This caused a panic selling reaction from retail investors, which further weakened market sentiment.
4. ETF Outflows and Liquidation Chains
Finally, the nature of the crypto market itself was also a major factor in accelerating the crash.
The Rise of BTC ETF Outflows
One of the primary drivers of the 2025 bull market was the spot Bitcoin ETFs.
However, between mid- January 2026 and mid-March 2026, these ETFs experienced a net outflow of around $6.81 billion. Out of this, around 3B+ outflow was seen in single month of January.
This removed a significant source of buying pressure from the market.

Leveraged Liquidations
Additionally, the crypto derivatives market was heavily leveraged.
When prices began to fall, traders using borrowed funds were automatically forced to liquidate their positions.
In some cases, more than $1.5 billion in long positions were liquidated within a single 24-hour period. And in February, the market recorded 10th largest single day liquidation event in history.
This created a cascade effect:
- Prices fall
- Leveraged traders are liquidated
- Forced selling pushes prices even lower
- More liquidations occur
This feedback loop turned normal price corrections into violent flash crashes.
A Quick Look at 2026 Crypto Crash

The chart above provides a quick view of the two-month decline in BTC/USD prices. As the market’s leading cryptocurrency, Bitcoin is used here to represent the broader market trend.
The red area highlights the continuous price drop, reflecting the impact of long-term structural pressures on the market. Meanwhile, the short-term events that intensified negative sentiment and accelerated the downside momentum are marked separately in the chart.
Conclusion
The 2026 crypto market crash does not necessarily signal the end of the industry. Instead, it represents a painful step in the market’s evolution.
The speculative bubble of the 2025 bull market is being replaced by a more complex environment shaped by:
- inflation
- geopolitics
- institutional risk management
- technological security risks
As a result, capital is gradually moving away from experimental and highly leveraged projects. Instead, investors are focusing on assets that are more compliant, secure, and acceptable from an institutional perspective.
In many ways, the current crypto crash reflects the transition of cryptocurrency markets from a “Wild West” phase toward a more mature financial system—one that must adapt not only to institutional oversight but also to emerging technological threats such as quantum computing.
Written by: Saman Ali
Disclaimer:
This article is for informational and educational purposes only and does not constitute financial, investment, trading, or legal advice. Always do your own research or consult a licensed advisor before making trading decisions.
Technical Analysis in Trading: The Map, The Trap, and The Edge

Technical Analysis in Trading: The Map, The Trap, and The Edge
Technical analysis is the most widely used methodology in speculative markets, and ironically, the most widely misunderstood. Traders deploy TA across forex, CFDs, cryptocurrencies, stocks, shares, commodities, and indices believing they are gaining foresight into future price. What they are often gaining instead is pattern recognition bias dressed as analysis, and that bias is the single fastest route to capital destruction. Unlike investing, trading operates in leveraged environments, tight invalidation windows, and rapidly shifting market regimes — meaning TA was never designed to tell you what will happen, but to tell you what is happening, and more importantly, what must not happen for your idea to remain valid. The trader who confuses interpretation with prediction eventually loses everything, not because TA doesn’t work, but because they used it for a purpose it was never meant to serve.
The Anatomy of the Technical Illusion
Retail traders approach charts like historians searching for repetition. They believe if price bounced off a level before, that level now carries an invisible force field into the future. This creates the illusion of control and certainty. The market occasionally rewards this thinking, not because the analysis was correct, but because price simply revisited a liquidity pool that happened to align with a drawn level. The danger lies in the other 90% of the time, when price doesn’t respect those levels at all — it weaponizes them. Markets are engineered around liquidity consumption. Support and resistance are often not barriers, but magnets, used by institutions to trigger stop-loss waterfalls, fill large orders, and reverse price only after retail capital has been harvested. The chart looks predictable in hindsight, but unpredictable in execution, which is exactly how the trap is constructed.
Examples of Static TA Thinking That Would Destroy Traders

1. “Historical Support Always Holds” – The Nasdaq Fallacy
Consider the Nasdaq 100 index — a favorite CFD instrument for global traders. If a trader in 2010 had studied the previous decade of price action, they would have found a clean market structure of swing lows repeatedly defending the 1800–2200 zone. A static-thinking technician would conclude that future pullbacks into this region must present long opportunities. Fast forward to 2020, when the index collapsed from 9700 to 6600 in under one month — ripping through 10 years of historic support. Traders who bought because “support always held in the past” would have endured a 30% loss in weeks on leveraged margin. Many would double down at 7200, believing in mean reversion, only to face further liquidation sweeps before price recovered. Then again in 2022, Nasdaq fell from 16,500 to 10,500, a 36% drop, once more ignoring long-term structure entirely. A trader using high CFD leverage without invalidation logic wouldn’t lose 30% or 50% — they would lose 100%, repeatedly re-entering the same collapsing zones until margin failure. The mistake wasn’t technical analysis — the mistake was believing that TA predicted the future instead of describing the present. TA should have told them: “If price closes below 6600, the long idea is invalid — regardless of history.” But history blinded them, and the market punished them for it.
2. “Resistance = Reversal” – The XAU/USD Trap
Gold (XAU/USD) has been in a powerful macro uptrend over the past 2+ years, making it one of the most attractive CFD instruments for breakout and carry-flow traders. Between 2023 and 2025, price formed extremely visible resistance zones at 1930, 1985, 2050, 2075, 2145, and 2200. Retail traders treated each as a reversal fortress. Every indicator screamed overbought. RSI sat above 70 for weeks at a time. MACD was extended. Commentators called for correction after correction. What actually happened? Gold blew through each resistance zone, sometimes retraced briefly, and then continued trending 400–1200+ pips higher. Traders who sold at resistance without regime awareness experienced a phenomenon that destroys most technicians:
-
Overbought stayed overbought
-
Resistance became support after liquidity sweeps
-
Stop losses were triggered above highs before real reversals
-
Trend continuation made static levels irrelevant
In leveraged CFDs, this behavior would repeatedly liquidate traders selling resistance, even though the analysis looked logical. The market didn’t reverse because resistance was broken — it reversed after liquidity was consumed beyond resistance, once institutions were filled. The professor’s rule applies: “A level is only valid until price behavior invalidates the thesis.” Not a second longer.
3. The “Carry Pair = Safe Support” Catastrophe
Let’s take carry trading favorites like USD/TRY or USD/ZAR, often traded via CFD platforms for swap or trend exploitation. A trader may analyze USD/TRY from 2018 to 2020 and observe repeated price stabilization around 5.80–6.20. Support looks impenetrable. But by 2023 the pair traded above 25.00 — a 300%+ currency devaluation, completely disregarding previous structure. Even if swap was positive, any leveraged trader holding longs at historic support without invalidation rules would be obliterated, because the market shifted regime entirely when inflation dynamics, central bank credibility, and macro volatility altered capital flows. Technical analysis should have told them to adjust SL and trend bias using volatility measures like ATR or momentum filters like ADX, but static level reliance would have wiped them out long before swap accumulation mattered.
4. “Chart Patterns Always Play Out” – The Bitcoin Graveyard
Crypto markets are TA-heavy ecosystems, meaning the trap density is even higher. Between 2021 and 2024, Bitcoin formed dozens of textbook patterns:
-
Double tops at 69,000
-
Head & Shoulders breakdowns
-
Bull flags
-
Falling wedges
-
Ascending triangles
Retail traders treated each as a future guarantee. What did the market do instead? It delivered fakeouts in both directions, sweeping lows to 15,500 in 2022 (-77%), then rallying back to 73,000 in 2024, trapping shorts and longs symmetrically. Traders who believed chart patterns guaranteed price direction were wiped out not by market movement, but by market sequencing — liquidity sweeps first, narrative logic last. The lesson here for all markets is that TA must evolve into a rules-based framework:
“If the pattern fails, the trade fails. If the market regime changes, the strategy changes. If liquidity is taken, wait for confirmation, not nostalgia.”
TA Best Practices That Keep Traders Alive

1. Think in Scenarios, Not Forecasts
Professional traders never conclude with “price will go here.” They conclude with:
-
“If price breaks and closes above this range → continuation likely.”
-
“If price rejects after liquidity sweep → reversal scenario active.”
-
“If volatility expands beyond threshold → reduce size or widen risk logic.”
This keeps ego out of execution and capital alive long enough for probability to matter.
2. Invalidation Is More Important Than Confirmation
Most traders look for confirmation. Professionals look for invalidation first. A good rule:
-
A trend trade is dead when structure breaks against position and holds
-
A range trade is dead when expansion invalidates mean-reversion logic
-
A pattern trade is dead when the pattern fails before RR plays out
TA should protect capital before it attempts to grow it.
3. Use Indicators as Behavioral Filters, Not Directional Oracles
The following indicators are statistically useful when applied correctly:
Trend Identification
-
20/50/200 Moving Averages → directional bias and regime structure
-
ADX → trend strength vs range regime
-
Above 25 = trend confirmation
-
Below 20 = avoid trend strategies
-
Momentum Awareness
-
RSI → only reliable for reversals when market is not trending
-
MACD Histogram → momentum contraction/expansion behavior
Volatility and Risk Distance
-
ATR → SL/TP distance based on true volatility
-
Bollinger Band Squeeze → breakout loading detection, not breakout direction
Volume (Critical for Crypto, Shares, Indices, CFDs)
-
Volume Profile → institutional value zones
-
VWAP → fair-value pricing bias
-
Relative Volume spikes → participation detection
A clean chart with 2–3 behavioral filters outperforms a noisy chart with 10 indicators every time.
TA Conclusion Every Trader Must Internalize
Technical analysis is essential in every speculative market because it reveals participation, structure, momentum, and liquidity faster than any fundamental headline ever will. But the moment a trader believes TA gives them future knowledge, they detach from reality and attach to bias — and the market always punishes that transition. Nasdaq would have destroyed anyone relying on 20-year support lines. Gold would have destroyed anyone selling every resistance tap for 2 years. Bitcoin would have liquidated anyone trusting every textbook pattern without invalidation logic. TA is not the art of being right — it is the art of structuring decisions, defining risk, reading behavior, and executing with discipline in uncertainty.
The future of price is unknown. The risk on your trade should never be. That is the edge.
Disclaimer:
This article is for informational and educational purposes only and does not constitute financial, investment, trading, or legal advice. Always do your own research or consult a licensed advisor before making trading decisions.
Our #1 Trusted Partner - TiBiGLOBE

Complete Guide to Crypto CFDs

Complete Guide to Crypto CFDs
1. What Are Crypto CFDs?
Crypto CFDs (Contracts for Difference) allow traders to speculate on the price movements of cryptocurrencies without owning the underlying asset. Instead of buying actual Bitcoin, Ethereum, or other cryptocurrencies, traders enter a contract with a broker to exchange the difference in price from the opening to the closing position.
Key Features of Crypto CFDs:
-
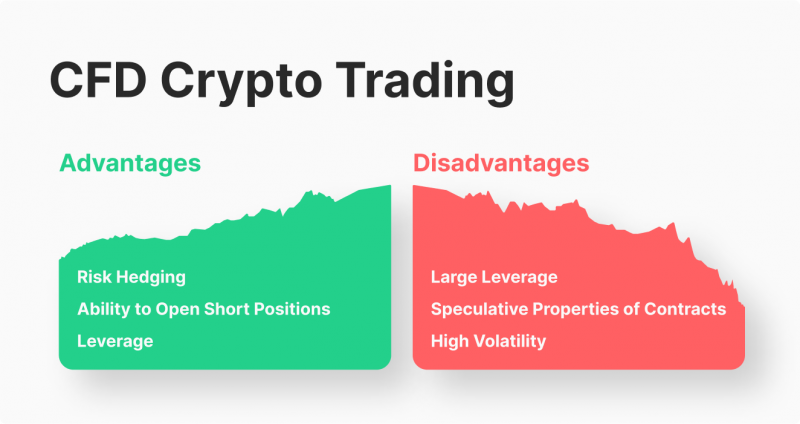
Leverage: Trade with a fraction of the capital required for full ownership.
-
Short Selling: Profit from both rising and falling markets.
-
No Need for Crypto Wallets: Avoid security risks associated with direct cryptocurrency ownership.
-
Fast Execution: Instant buying and selling through CFD platforms.
2. How Do Crypto CFDs Work?
When trading a Crypto CFD, you take either a long (buy) or short (sell) position based on whether you believe the price will go up or down.
Example:
-
Buying (Long Position): You enter a long trade on BTC/USD at $40,000.
-
If the price rises to $42,000, you earn the $2,000 difference.
-
If it drops to $38,000, you lose the $2,000 difference.
-
-
Selling (Short Position): You enter a short trade on BTC/USD at $40,000.
-
If the price drops to $38,000, you earn the $2,000 difference.
-
If it rises to $42,000, you lose the $2,000 difference.
-
3. Crypto CFD Trading vs. Spot Trading
| Feature | Crypto CFDs | Spot Trading (Buying Actual Crypto) |
|---|---|---|
| Ownership | No | Yes |
| Leverage | Yes (higher risk) | No |
| Short Selling | Yes | No |
| Security | Broker dependent | Risk of hacks, requires a wallet |
| Regulation | Varies by broker | Depends on exchange policies |
4. Risks of Trading Crypto CFDs
Like any leveraged trading, Crypto CFDs come with significant risks:
-
High Volatility: Crypto markets experience rapid price swings.
-
Leverage Risks: Amplifies gains but also increases potential losses.
-
Overnight Fees: Holding CFD positions overnight incurs swap fees.
-
Regulatory Uncertainty: Crypto regulations vary across jurisdictions.
5. How to Trade Crypto CFDs Safely
✅ Use a Regulated Broker – Choose a trusted CFD broker with strong security and compliance standards.
✅ Manage Risk with Stop-Loss Orders – Set limits to minimize potential losses.
✅ Start with a Demo Account – Practice before investing real money.
✅ Follow Market News & Analysis – Stay updated on crypto trends and events affecting prices.
6. Popular Crypto CFD Brokers
Choosing the right broker is crucial for a secure and efficient trading experience. Here are some well-known platforms offering Crypto CFD trading:
1. eToro
-
Regulated by FCA, CySEC, ASIC
-
User-friendly platform with copy trading features
-
Offers leverage and multiple crypto CFD options
2. Plus500
-
Regulated by FCA, CySEC, ASIC
-
Competitive spreads with no commission fees
-
Advanced risk management tools
3. FXPRO
-
Well-established and regulated broker
-
Offers competitive spreads and leverage options
-
Provides multiple trading platforms, including MetaTrader 4/5
4. Fusion Markets
-
Low-cost trading with tight spreads
-
Supports a wide range of cryptocurrencies for CFD trading
-
Provides high-speed execution and a user-friendly interface
5. AvaTrade
-
Regulated by multiple financial authorities
-
Offers fixed spreads and competitive trading conditions
-
Provides MetaTrader 4 and 5 for CFD trading
7. Strategies for Trading Crypto CFDs
To maximize your potential in Crypto CFD trading, consider the following strategies:
1. Trend Following
-
Identify long-term market trends and enter trades accordingly.
-
Use indicators like moving averages and RSI to confirm trends.
2. Scalping
-
Enter and exit multiple trades in short time frames.
-
Take advantage of small price movements for quick profits.
3. Swing Trading
-
Hold positions for a few days to weeks, capitalizing on medium-term price swings.
-
Utilize support and resistance levels for trade entries.
4. Hedging
-
Open both long and short positions to mitigate risks during uncertain market conditions.
Conclusion
Crypto CFDs offer traders a flexible way to gain exposure to cryptocurrencies without directly owning them. While they provide advantages like leverage and short-selling opportunities, they also come with risks. Understanding these factors and employing risk management strategies is key to successful trading.
Disclaimer:
This article is for informational and educational purposes only and does not constitute financial, investment, trading, or legal advice. Always do your own research or consult a licensed advisor before making trading decisions.


