

Displaying items by tag: war
How the Iran Conflict Is Impacting the Dollar, Gold, Oil, Stocks, and Treasury Markets

How the Iran Conflict Is Impacting the Dollar, Gold, Oil, Stocks, and Treasury Markets
In just five trading sessions, markets went from debating Fed cuts to preparing for possible rate hikes in 2027. Behind that shift: exploding war costs, a 6.0% PPI shock, and a dollar that refuses to weaken.
In this article, we discuss the impact of Middle East tensions on markets, how defense spending affects the economy, why the Fed may not cut rates in 2026, why the dollar is strengthening again, Key DXY levels to monitor, and why gold is falling despite inflation.
Pentagon Raised Warning of Increased War Costs
According to the Pentagon's testimony to Congress, the ongoing Operation Epic Fury has already cost American taxpayers $29 billion so far this year. In other words, the cost of the US-Iran conflict increased by $4 billion just in two weeks' time. Pentagon's acting comptroller Jay Hurst says that roughly $24 billion of those expenses were needed to repair and replace the equipment destroyed by the war. "But we have a lot of unknowns there," says Hurst, referring to expenses for repairs at US military bases damaged in the fighting.
How does the Iran war affect the US dollar? Fiscal impacts from such a large-scale conflict are not to be ignored, especially when the Department of Defense is now trying to push for an extra $1.5 trillion for US defense budget 2027. At the same time, Republican congressman and head of the House defense subcommittee Ken Calvert asked whether the operation would have a negative impact on US military readiness over the long term.
These concerns show the first signs of a hawkish shift in fiscal policy among fellow Republicans who stand alongside the White House. In other words, war spending will lead to widening budget deficits and a growing supply of US government bonds, causing further crowding out effects for private investment.
In addition to fiscal impacts, there is an even faster one that is likely to come through the channel of energy.
How Iran War is Impacting US Inflation and Fed Decisions?
April CPI came in at 3.8% y-o-y, which is the highest figure since May 2023 and above the consensus forecast of 3.7%. Meanwhile, the rise in energy costs was as high as 17.9% y-o-y, while gasoline prices increased by 28.4% y-o-y, and fuel oil prices by 54.3% y-o-y. What is especially concerning to investors: core CPI, excluding food and energy, jumped 0.4% m-o-m and 2.8% y-o-y, above expectations.
But that was nothing compared to today's print. The latest PPI reading stood at 6.0% y-o-y and crushed the consensus estimate of 4.9%. Month-over-month change in producer prices also skyrocketed, reaching 1.4% and almost three times exceeding the anticipated 0.5% increase. What does it mean? If producer prices continue to grow at such a fast pace, the inflationary pressure in the consumer sector remains intact as well. Excluding food, energy, and trade, core PPI increased by 0.6% m-o-m and 4.4% y-o-y. Read our latest analysis to learn more about oil war’s impact on food prices.
Now to answer the question; Will the Fed cut rates in 2026?It doesn't really require deep expertise in economics to realize that this data kills the whole idea of rate cuts in H2 2026. Bank of America recently moved its projections for the first rate cut to H2 2027. According to the CME Fed Watch index, currently, zero chances are seen for rate cuts in 2026, while 70+ percent probability stands for a rate hike in April 2027. In terms of interest rates, this represents an enormous re-pricing over just five trading sessions.
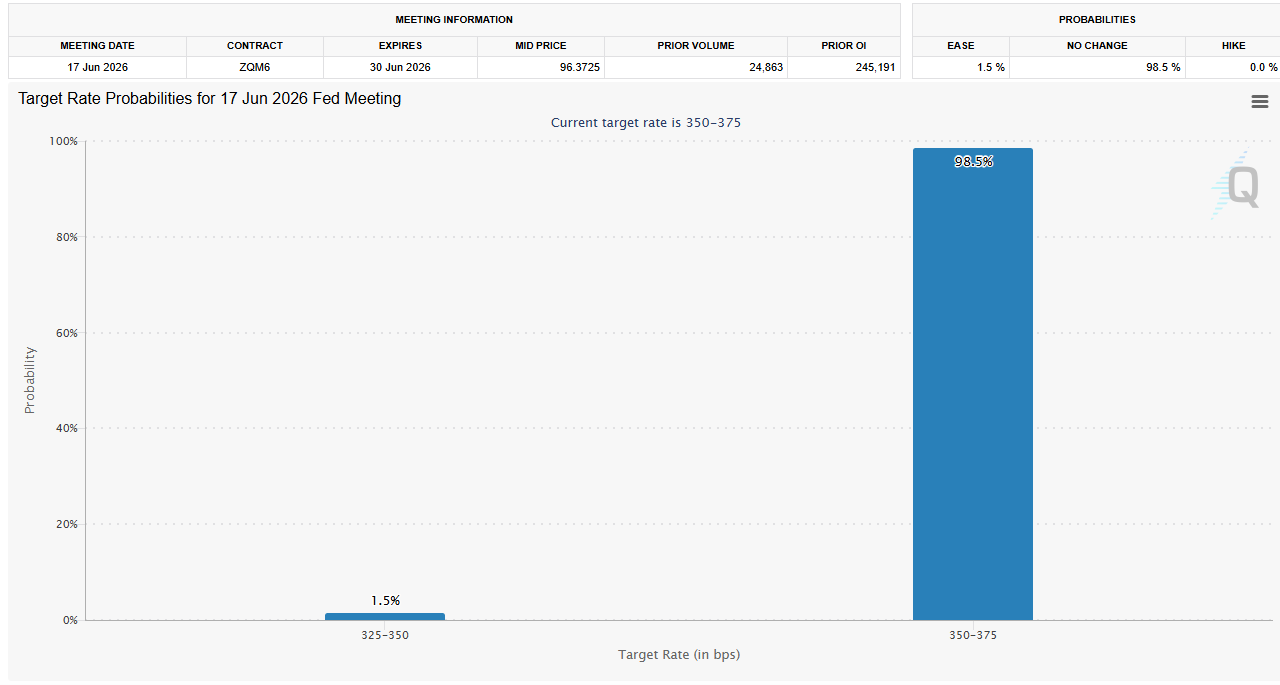
Image Source: CME FedWatchTool
Bond Market Update
As for the impact on treasury markets, bond yields have soared after the latest release. 2-year yield rose above 4%, whereas 10-year yield climbed to the highest level in ten months at 4.48%.
Dollar Index Technical Analysis (DXY)
The USD Index is currently sitting at 98.60 as a support for the safe haven amid an inflation surprise and rising tensions in the Middle East.
- Structural Ceiling: It goes without saying that the 2026 high at 99.18 (achieved back in April 8 on the failed ceasefire attempt) serves as the structural ceiling.
- Structural Floor: 97.60-97.80 stands as the established floor in this case. A breakdown below 97.60 on the confirmed close would lead to a retest of 97.00 followed by Cambridge 90-96 year-end target.
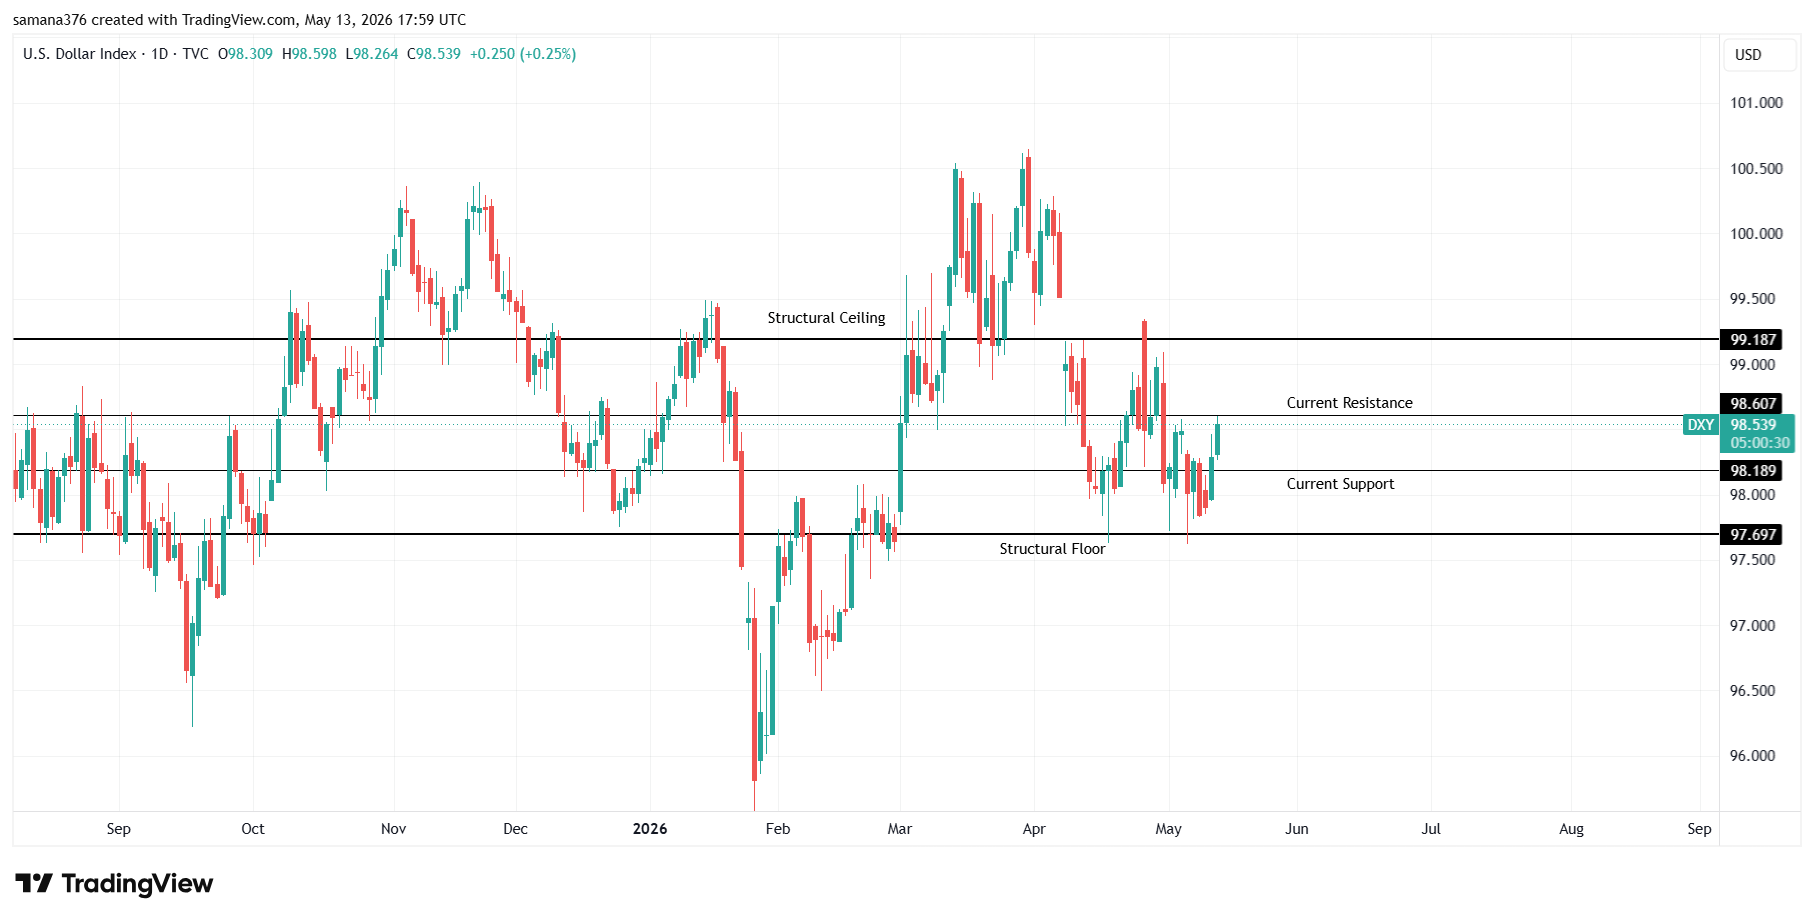
Image Source: Trading View
At the moment, the dollar is being pulled towards 98.60 due to the CPI/PPI surprises and growing pessimism about the possibility to achieve peace in Iran. Once the reflationary effects are exhausted, the structural factors of dollar bearishness would return – including fiscal expansion, Fed hawkishness constrained by a supply shock, and a war that increases both oil prices and weakens consumer demand. The bias above 98.20 remains negative in my view until the dollar closes above 98.60 on the daily timeframe.
How the Dollar Drives Other Financial Markets
Once you understand the situation around the USD Index, the outlook of best assets during inflation and war becomes obvious:
- Crude Oil: It is hovering around $101 per barrel (WTI) and $103.8 per barrel (Brent). Peace agreement between Washington and Tehran would be bullish for oil and bearish for the dollar. As the IEA warns, global oil reserves "are rapidly shrinking," which should create a near-term floor for Brent. To track US-Iran war effect on oil prices, be on the watch for the test of $100 level, which would indicate that peace negotiations are moving ahead.
- Gold: After the inflation data was released, gold suffered a sharp sell-off with a test of the support near $4,600. Why is gold falling if inflation is rising?Well, gold is mostly priced by real yields. When inflation rises, and Federal Reserve prepares for more rate hikes, real yields become extremely attractive. Gold waits for the Fed to blink.
- Silver: Opened at $86.36, it went as high as $88.3 by mid-day (2.23% daily gain). The silver price rally has continued for seven days in a row (from $72 to $88.3 in just seven trading days). But silver is the precious metal that reacts quickly to any dovish signals from Washington or Beijing, because at the moment, the gold/silver ratio stands at 53:1.
- EUR/USD: The euro-dollar pair is hovering near 1.1710 as the dollar strengthens against it. EUR/USD is a direct beneficiary of the peace talks. By H2 2026, according to Cambridge's forecasts, the pair is expected to reach 1.18-1.23, but this will only happen once the Strait of Hormuz opens again.
- US Stocks: Yesterday, NASDAQ fell 0.87%, and the S&P 500 dropped 0.67% amid stock market inflation fears. S&P 500 futures struggle to recover from a loss caused by 1.4% MoM PPI print. Defensives outperformed, semiconductors underperformed.
What’s Next?
The Trump-Xi summit will take place in Beijing today through Friday. Iran issue will be discussed during the talks, although Trump himself says that the main topic will be trade relations. The market expects a clear sign that Beijing favors peace talks – a general statement that the conversations were productive would have little impact, while a promise to address the issue in more detail would be a game changer.
- Today's 6.0% print has killed the chance of rate cuts for good. If the dollar cannot break 99.18, it would mean that the bull run has finished.
- The Handover: Janet Yellen will hand the keys to the new Fed Chair, Jerome Warsh, on Friday. His first public appearance in that role will attract attention of each and every fixed income trader in the world.
The dollar isn't going anywhere anytime soon – and it's waiting for the hawkish chair to give some reactions to 6.0% inflation rate. There is nothing much that can be done right now but knowing the levels and triggers.
Written by: Saman Ali
Disclaimer:
This article is for informational and educational purposes only and does not constitute financial, investment, trading, or legal advice. Always do your own research or consult a licensed advisor before making trading decisions.
The Oil War on Your Plate: How Iran War Is Causing Global Food Crisis 2026

The Oil War on Your Plate: How Iran War Is Causing Global Food Crisis 2026
After a Pakistan-brokered ceasefire briefly calmed markets last week, the Islamabad talks collapsed on two irreconcilable points: Iran's insistence on controlling the Strait of Hormuz and its refusal to dismantle its nuclear program. Trump called it "a really good meeting, except for the one thing that really mattered."
The Strait of Hormuz is still closed. And now, the US has moved from diplomacy to naval blockade.
The Strait of Hormuz food supply route, through which 27% of global oil exports, 20% of LNG, and up to 30% of the world's fertilizer trade flows, has been functionally impaired since February 28.
Does oil war cause food shortage? The answer is Yes.
Urea fertilizer is still 50% more expensive than pre war levels. The Northern Hemisphere's spring planting window is closing with farmers short on nitrogen they cannot source or afford. And the supply chain disruption, slow-moving, invisible, and already in motion, will take 6 to 12 months to fully surface in harvest yields, grocery prices, and hunger statistics.
This article is about that oil war food crisis 2026. What the oil war has already done to the global food system, and what happens to your grocery bill, and to 45 million people on the edge of acute food insecurity, if situation goes further wrong.
How Oil Becomes Food?
Most people know that higher oil prices mean higher gas prices. What far fewer people understand is that oil impact on food supply chain runs far deeper. Oil doesn't just move food, it fundamentally makes it. There are three different channels through which an oil price shock reaches your dinner table, and they operate on very different timelines.
1- Transportation:
Diesel powers every truck, ship, and train that moves food from farm to processor to warehouse to shelf. Higher fuel costs hit first and compound at every single handoff in the food supply chain.
2- Fertilizer:
Nitrogen fertilizers are made from natural gas and oil-linked commodity. Energy price spikes drive fertilizer price spikes. However, this channel has a 6–12 month delay before it shows up in harvest yields and food production costs.
3- Biofuels:
When crude is expensive, biofuel crop diversion food crisis becomes more profitable. Governments divert corn, palm oil, and soybeans into energy instead of food. Hence, it causes tight global grain supplies and ultimately drives up food prices across the board.
Now Why Your Grocery Bill Hasn't Peaked Yet?
If you are wondering how does oil price affect grocery prices in practice, the answer is: slowly, then all at once.
A 2025 analysis from the Federal Reserve Bank of Kansas City confirmed what any supply chain analyst will tell you: a 10–20% oil price increase doesn't translate one-for-one into grocery prices right away. Rather, the full effect takes months to work through multiple layers of the system. But when it does arrive, food inflation is stickier and harder to reverse than energy prices. And the fertilizer channel's 6–12 month delay means the worst of this year's shock is still ahead of us.
What’s the Fertilizer Crisis?
While crude oil prices dominate the headlines, the smarter money is watching fertilizer prices 2026. And what its showing should alarm anyone who eats. The situation is arguably worse than the oil crisis, because there is no emergency release valve for fertilizer shortages and just like other shipments, fertilizer shipments are also blocked at the strait, making the Hormuz blockade food supply chain disruption far more dangerous than most realize.
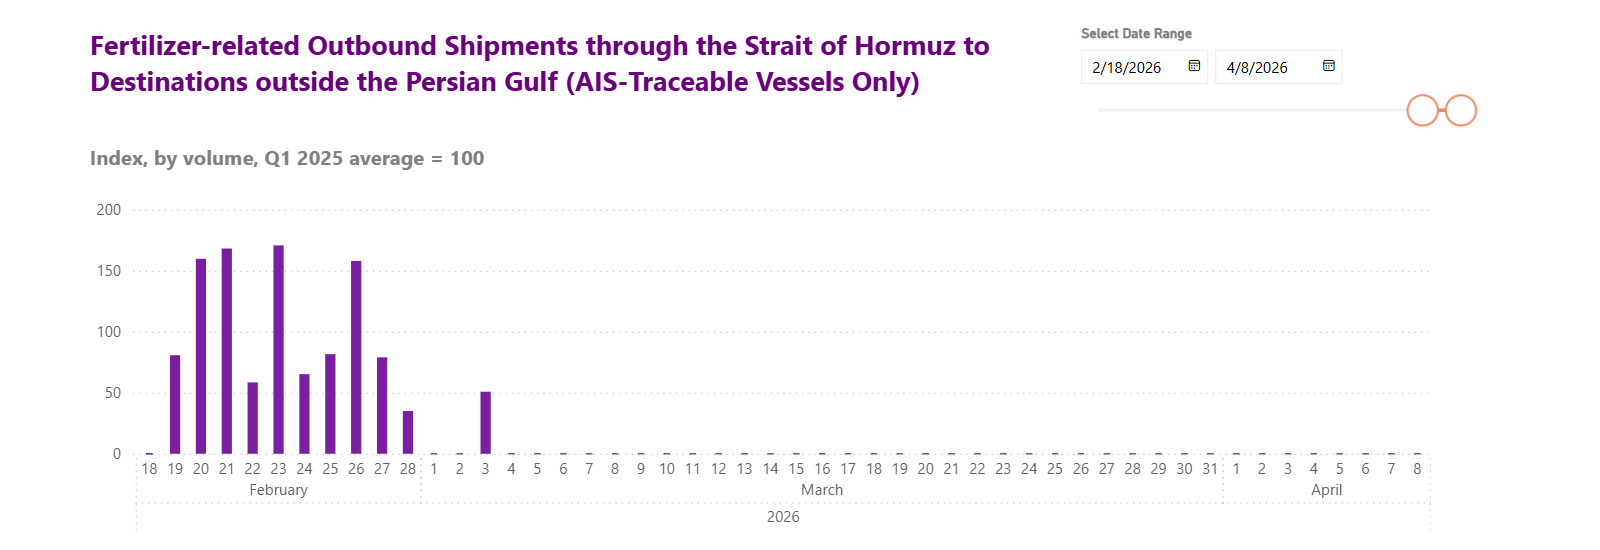
The cost of FOB granular urea in Egypt, which is the global bellwether for nitrogen fertilizer prices, has jumped from $400–$490 per metric ton before the war to around $700 per metric ton. Oxford Economics reports that urea prices agriculture 2026 are up roughly 50% and ammonia around 20% since February 28. In the United States, urea at the New Orleans import hub jumped 32% in a single week, from $516 to $683 per metric ton, with prices up 77% from mid-December 2025. Timing couldn't be worse, because, this is peak spring planting season.
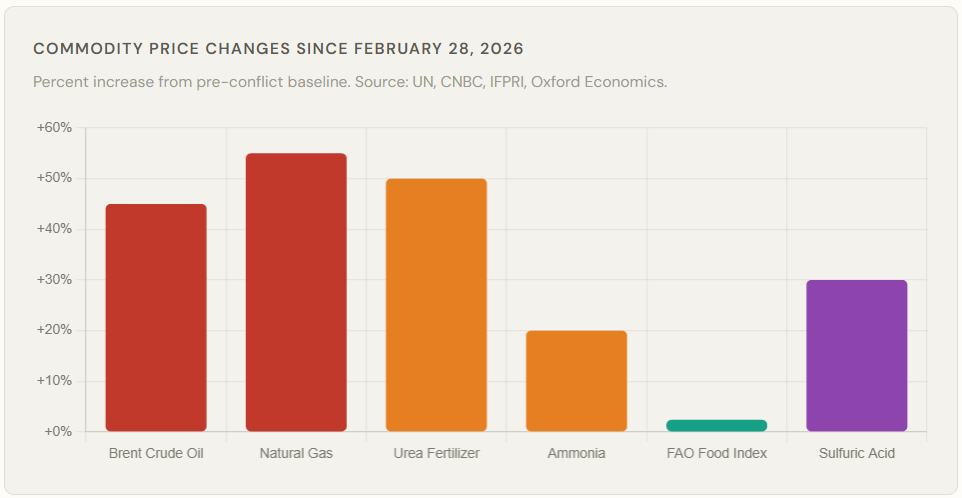
What makes fertilizer prices so catastrophic is structural. Countries hold strategic petroleum reserves which means, governments can release oil to buffer a supply shock. In contrast, there is no strategic fertilizer reserve anywhere on the planet. No bypass pipeline for urea. No OPEC-equivalent that can ramp production overnight. Therefore, Hormuz crisis is really two crises sharing one waterway, and the fertilizer crisis has absolutely no shock absorber.
According to IFPRI, the Middle East controls an outsized portion of the global fertilizer market, with Saudi Arabia, Iran, Qatar, Kuwait, and the United Arab Emirates exporting 36% of global urea shipments, nearly 50% of global sulfur trade, and 25% of ammonia worldwide. In contrast to the Russia/Ukraine war, which had impacted only one or two big producers of fertilizer, this conflict has affected all of them at once, therefore causing food insecurity.
Food Prices Overview
Data is starting to move – and it's all in the same direction. Will food prices go up because of Iran war? They already have.
According to the UN Food and Agricultural Organization (FAO), there has been a 2.4% increase in its FAO Food Price Index 2026 in March alone, the biggest single-month increase since 2022. Food cereals prices increased around 1.7% month-on-month, with the sole driver behind the move being increased fertilizer and energy prices, causing Iran war food inflation.
In addition, according to USDA projections, there will be 3.6% of overall food price increases in 2026, with beef being 14.4% costlier compared to last year as of February. Eight of 15 food-at-home categories in the USA are currently experiencing annual growth rates above their historical averages of the past 20 years.
What's more important, according to FAO's forecast, if fertilizer use decreases due to the high costs, the next round of harvest would be reduced, triggering harder food price wave during the latter part of 2026. This is not a forecast; this is agricultural math.
Who is at Most Risk?
Not all countries will feel this food security oil price shock equally. The vulnerability will depend on three primary factors: dependence on food imports, exposure of the energy sector to changes in global oil price dynamics, and, crucially, how much of the household budget is used to purchase food items.
The lower the income level, the higher the vulnerability of this population. The pattern of food inflation Middle East 2026 data already confirms this — and for developing countries food oil shock exposure, the situation is especially acute.
|
Region / Country |
Food as % of Income |
Primary Exposure |
Risk |
|
Sub-Saharan Africa |
50–70% |
Grain imports, fertilizer access, currency weakness |
Critical |
|
South Asia (India, Pakistan, Bangladesh) |
45–60% |
Heavy LNG & fertilizer imports from Gulf; thin reserves |
Critical |
|
Gulf States (food importers) |
30–45% |
90%+ food import dependency; Hormuz is their supply lane |
Critical |
|
Europe |
12–20% |
Diesel, jet fuel & fertilizer sourced from Gulf; gas price surge |
High |
|
Latin America (Brazil) |
18–28% |
World's largest fertilizer importer — 49M metric tons in 2025 |
High |
|
United States |
~10% |
Domestic energy buffer; urea import costs hit spring planting hard |
Moderate |
|
China |
~18% |
Large strategic reserves; slower-burning, longer-term exposure |
Moderate-Low |
With the Brent oil price currently standing at $110 per barrel, 55% increase from late-February level of $71, the model suggests food prices may increase by 14%. This means that for families spending 70% of their income on food, food price hikes will equate to a sudden drop of 10% in real income.
And it is not luxury items that get cut first; it's proteins, fruits, and vegetables. When young children under age of five lack food intake, it's a developmental disability that negatively impacts their cognitive ability, education, future earnings and nothing helps.
Historical Relationship Between Brent Crude & Food Price Index
If this situation sounds eerily familiar to you, it is because it is. FRED's data show how the Global Food Price Index moves together with Brent crude through any major geopolitical shock. Be it 2000-2005 energy boom, the food price hike amid the global financial crisis that briefly pushed Brent prices above $147 in 2008, the Arab Spring food riots that triggered further price increase in 2011 or the Russia/Ukraine War in 2022, when Brent surpassed the $120 mark and sent the FAO Food Price Index to an all-time peak.
The following image shows crude oil food prices correlation.
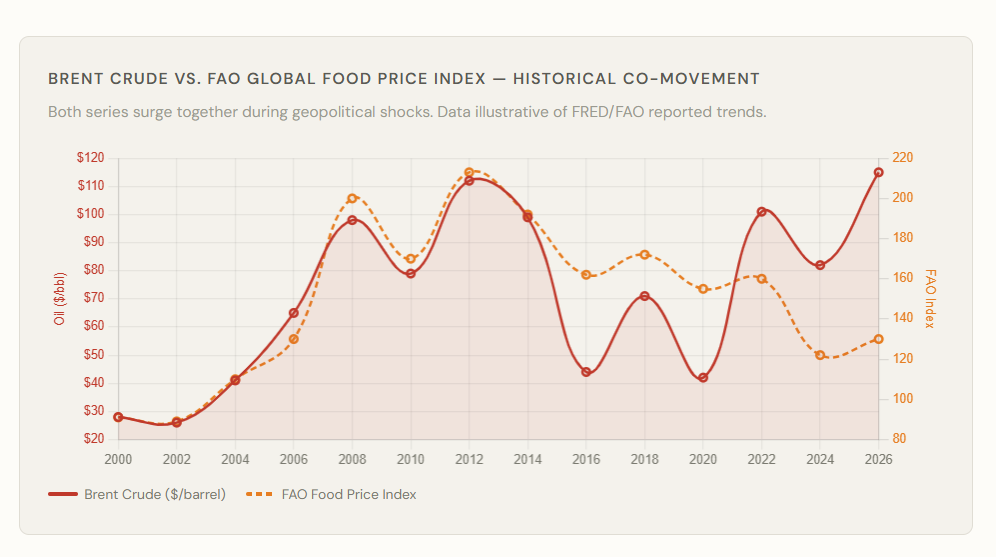
Each episode led to an unfolding food crisis, which was proportional to the duration of energy shock. Brent crude food inflation is not new, but in 2026, the duration of the crisis becomes the critical factor. Analysts suggest that the threat of inexpensive drones to the security of oil supply is what keeps the Strait closed despite multiple ceasefires; and that drone-based threats might linger for months even after launch facilities have been destroyed.
No wall is necessary across the Strait of Hormuz – the lingering threat will keep insurance companies out of business in the region. And this is already happening.
The Stagflation Threat is Real
Currently, the Brent oil price hovers around $100 a barrel. Economic growth forecasts are being revised downward. IMF projects an increase in global inflation and will release a new report on economic impact of war on global economy on April 14th.
This is a classic stagflation scenario: prices rising while growth slowing. The 1973 oil embargo and 1978 Iranian Revolution both started exactly like this – leading to global recession that lasted years.
The Fed finds itself in a dilemma without an easy way out. If the action against a short-lived energy shock occurs too early, this would lead to more problems rather than solve them. But delaying the reaction will allow stagflation food prices – far more stubborn and lasting – to embed itself in the economy.
Three Possible Scenarios for What Comes Next
How bad it gets will depend entirely on whether there will be a ceasefire agreement signed in Islamabad this weekend – and in the weeks to follow. The International Food Policy Research Institute warns of potential disruptions of fertilizer delivery to Asia as the most serious problem, if Hormuz remains closed.
Below are the probabilities of each of three scenarios:
Scenario 1- Ceasefire agreement holds
Pakistan’s Foreign Minister Ishaq Dar is pushing both sides to hold the ceasefire and keep talking. If quiet pressure gets them back to negotiations within days and an agreement lands quickly, the Strait reopens. Oil cools off to around $75–80. Food prices begin to settle, but the damage to spring planting is already locked in, so autumn 2026 harvests still come in below normal. Even in this best-case path, the system carries a few months of built-in strain.
Scenario 2- Partial ceasefire agreement; fragile peace
Both sides stick to a tense, no-shooting truce, but nothing moves diplomatically. The Strait remains effectively shut, and the US port blockade keeps pressure on Iranian exports. Brent hovers in the $95–105 range. Fertilizer stays expensive through the critical planting window. By Q3 2026, food prices jump 8–12% in import-dependent regions. The WFP’s projection of 45 million people facing hunger starts to materialize. Overall, global food security takes a noticeable hit.
Scenario 3 - Ceasefire fails; conflict continues
The US blockade provokes retaliation from Iran, and the Strait stays closed through the summer. Fertilizer shortages during spring planting lock in weaker autumn harvests across Asia and Africa. UN ESCAP estimates the region-wide inflation at 4.6% in 2026. However, this forecast is based on assumption that ceasefire will hold. With it failing, the numbers would deteriorate quickly. Financial models pointing to $150+ oil in a prolonged conflict stop looking extreme and start looking realistic. At that stage, the 2026 global food crisis isn’t hypothetical anymore.
Summary
While this crisis may sound like an energy story, this has never been the case. This is a global food crisis 2026, slowly developing across supply chains, fertilizer invoices, transportation costs, and planting decisions that have yet to be fully priced in.
Tragically, the people who did nothing to ignite this geopolitical dispute are the ones who suffer the most. Usually, an oil war is fought between military forces and diplomats. And a food crisis unfolds among families and in kitchens. But, right now, those two things are the same and falls under one crisis.
Written by: Saman Ali
Disclaimer:
This article is for informational and educational purposes only and does not constitute financial, investment, trading, or legal advice. Always do your own research or consult a licensed advisor before making trading decisions.
How the 2026 Oil War is Dismantling Marine Supplies

How the 2026 Oil War is Dismantling Marine Supplies
Most of us only notice cargo ships when packages are late or food prices spike. But the "hidden engine room" of the global economy is currently on fire.
What was a theoretical worry became a brutal reality on March 8, 2026, when Brent crude surged past $100, eventually peaking at $126 per barrel. While headlines focus on the US-Iran conflict, the real disaster is happening in the water: the Strait of Hormuz, the world’s most vital maritime "throat", has stopped functioning.
When that happens, the questions shift from politics to survival: What do you do when your fuel costs double in a single week? How does a ship keep running when the port it relies on for spare parts is suddenly a war zone?
This is a look at how a $10.1 billion industry is being dismantled in real-time. In this article, we will cover:
- The Fuel Crisis: Why bunker fuel prices have gone vertical.
- The Insurance Blackout: Why ships are grounded even when the water is clear.
- The Spare Parts Trap: How blocked routes are leading to engine failures.
- The Future: Three scenarios that will determine if global trade survives.
Why Marine Supplies Are So Exposed to the Oil War
To get an idea of the scale of destruction, one has to look closer at the share of oil in a ship. Although many people perceive a ship as a transport means, it is much more than that. A vessel can be regarded as a self-sufficient industrial city that requires constant supply of energy and spare parts.
Of course, oil products are needed to power its engines.
Many components of a vessel (e.g., pistons and valves) are made using steel and aluminum.
Logistics, which deliver these parts from warehouses to ships, are based on oil.
In 2025, the global marine spares and equipment industry had generated revenues worth of $10.1 billion, having grown 5.1% in comparison to the previous year. All this stability is now lost. Oil isn't just one factor in this industry; it is the fundamental "DNA" of every single operation.
Bunker Fuel Goes From Commodity to Crisis
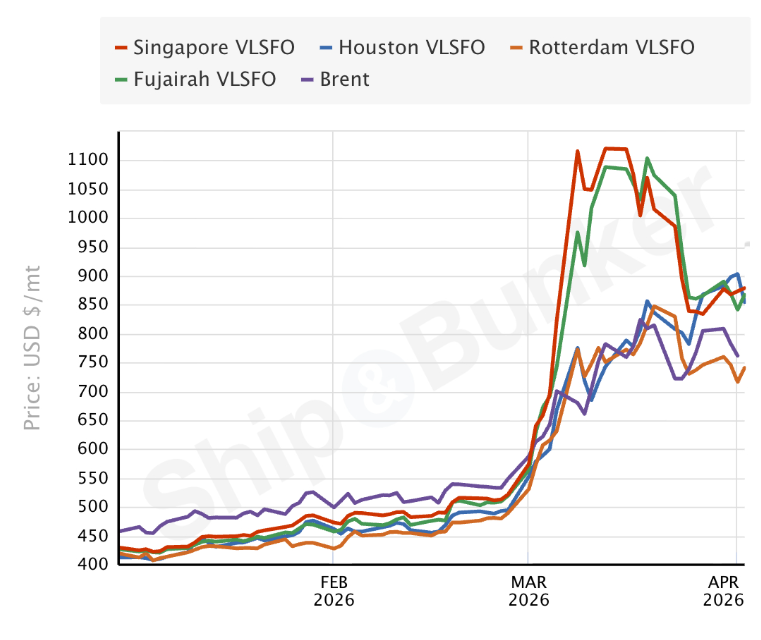
The main component of marine fuels is bunker fuel (Very Low Sulphur Fuel Oil, VLSFO). It accounts for 50% of overall costs of operating a ship. During the recent crisis, VLSFO's price has experienced a vertical growth.
According to Ship and Bunker statistics, VLSFO rate increased by 87% worldwide. Within two months, its price increased from $544 per tonne in late February to $1,125.50 in late March (the record price since the start of Russia-Ukraine War). The dynamics was as follows:
- High Sulphur Fuel Oil (HSFO): Increased its price by 112%, reaching the record high of $886 per tonne.
- Marine Gas Oil (MGO): The most sensitive part of the industry. The prices for MGO have risen by 160% since the beginning of the conflict.
In this regard, Constantinos Capetanakis, Chairman of the International Bunker Industry Association, said: "It's absolutely unprecedented."
The geography of this crisis made things even worse. First of all, one of the largest bunkering centers (Fujairah) was practically out of use after the attacks. Meanwhile, even such giant as Singapore, the largest fueling harbor, recorded the price increase of 106%.
As Maersk CCO put it, "Fuel remains available worldwide, but it is unevenly distributed." This imbalance is a direct consequence of the war.
When Carriers Start Charging Everyone More
Since the shipping companies have to deal with the rising costs, they pass them to consumers. This is where common people experience the consequences of the war, at a grocery shop or at work.
When VLCC supertanker's rate reached $423,736 per day (which is a 94% increase in just 48 hours), they decided to implement surcharges:
- Hapag-Lloyd: Added $160 per TEU in case of dry cargo.
- CMA CGM: Introduced peak surcharge worth of $400 per TEU and separate "Emergency Conflict Surcharge" of up to $3,000 per TEU in case of shipments to Gulf countries.
- Maersk & Seaboard Marine: Started to charge their clients via rolling bunker surcharges starting from late March.
One Indian shipper told S&P Global the situation is so bad that "shippers are not sending any cargo." When the cargo stops moving, the marine supplies stop moving too. It’s a total freeze of the system.
When Insurance Companies Simply Walk Away
As already noted above, marine insurance plays an extremely important role for the operation of ships. In case of absence of War Risk Insurance, vessel owners will bear all expenses related to the loss of property (about $100 mln, typically).
As soon as the conflict erupted, 21 commercial ships got under fire from Iran. In response, major insurers such as Gard, Skuld, and North Standard refused to provide coverage to ships in Persian Gulf area. For those willing to get War Risk Insurance, it becomes rather costly affair:
Peacetime insurance premium: 0.125% – 0.25% of ship's price.
Currently: 0.8% – 1.5%, with US/Israeli vessels insured for 10% or higher.
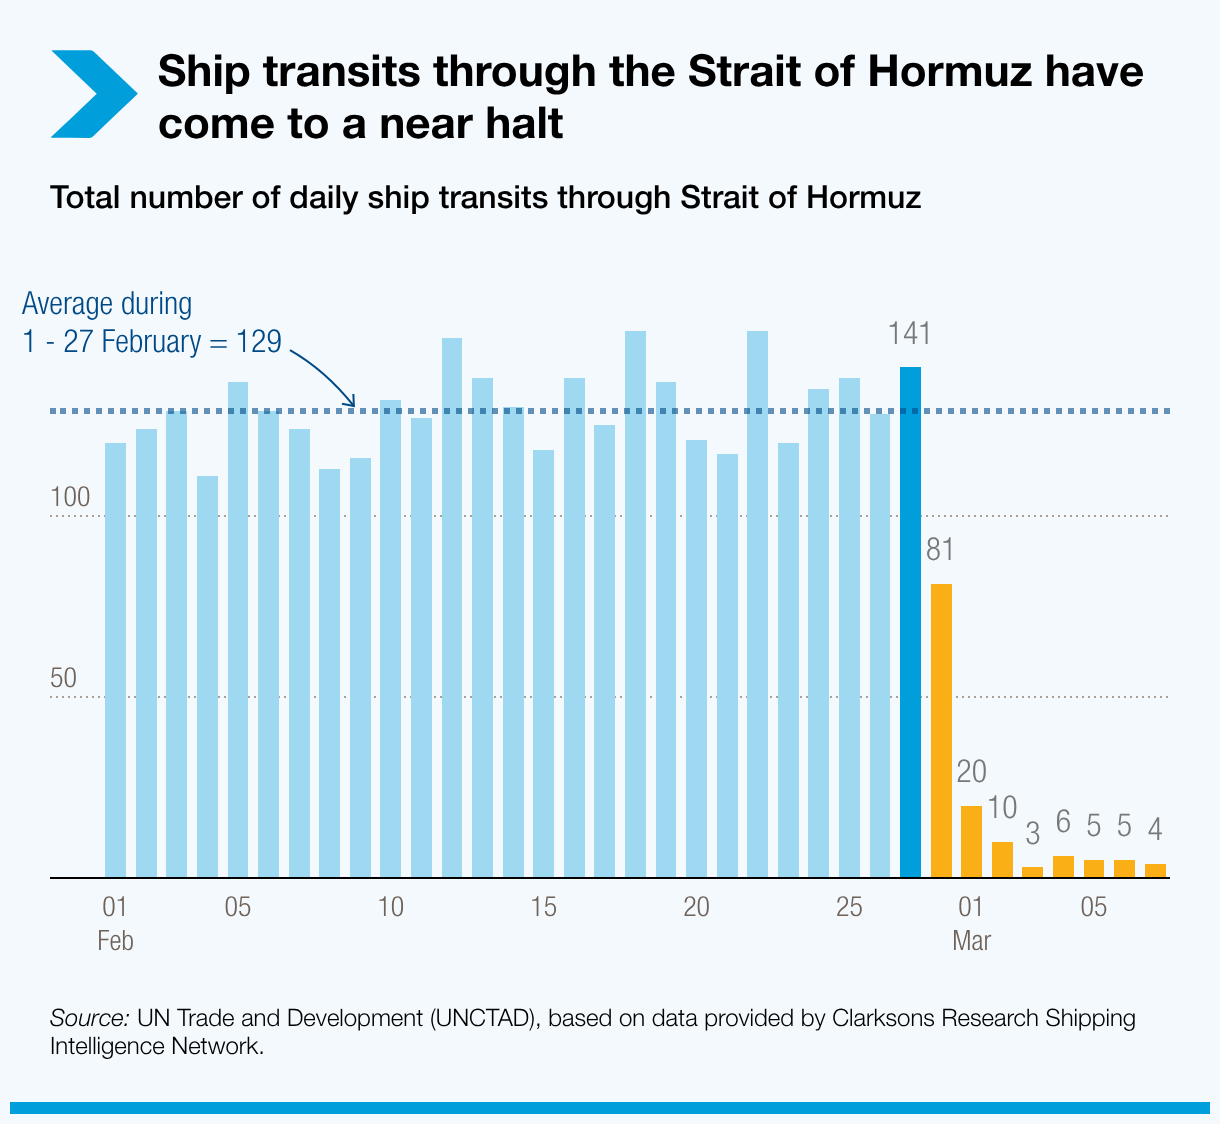
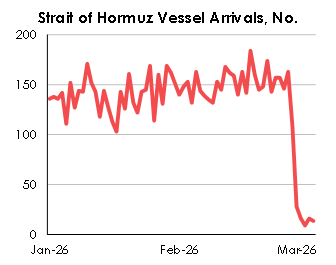
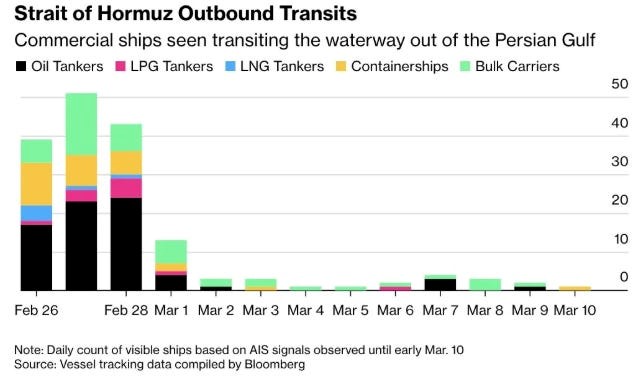
It resulted in a dramatic decrease in transit through the Strait of Hormuz. According to Clarksons Research, currently, only 13 ships managed to pass this waterway in a single week while under normal conditions 250 ships should have gone through. That equals to 95% decline in transit.
|
Peacetime premium 0.125% of vessel value per voyage
|
Crisis premium 0.8–2.5% for standard tonnage
|
US/Israeli-nexus vessels >10% per transit, where available
|
Hormuz transits — latest week 13 vs. ~250 normally (⇩ 95%)
|
What’s Happening to Spare Parts and Ship Maintenance
Of course, fuel is the most obvious aspect of crisis, but the worst may come later. As a matter of fact, the death blow could be delivered by breakdown of spare parts logistics. As mentioned before, ships need regular replacement of parts, which is possible because of four "pillars": Singapore, Rotterdam, Houston, and Fujairah/Dubai.
Now one of them is damaged due to military operations against Iran. As a result, by mid-March almost 1,000 tankers (22% of the global fleet) remain idle in the Persian Gulf.
This results in several negative effects:
- Stockpiling: The owners try to stockpile spares, buying them 30 days in advance, instead of 10. It, of course, affects storage capacity.
- "Cape" Effect: Tankers avoiding Persian Gulf are taking a longer route through Cape of Good Hope. This results in extra wear and tear.
- Deferred Maintenance: This effect can be extremely dangerous. Because spares are either delayed or become prohibitively expensive, the owners postpone their replacement. At some point, deferred repairs cause catastrophic damage to engines.
How Much Worse Could It Get?
As can be seen, the situation is dire at the moment. However, it is still not the worst-case scenario.
The disruption is also spreading beyond oil. LNG markets are now under stress, with tanker rates surging by 40% in a single day after Qatar halted production. The Strait of Hormuz typically handles around one-fifth of global LNG supply, and unlike oil, LNG has limited strategic reserves to cushion disruptions.
According to analysts, the situation is expected to worsen by mid-April. This is when the oil supplies held in the Strategic Petroleum Reserve and the oil supplies currently being allowed to flow due to sanctions are expected to exhaust themselves.
At the same time, geopolitical dynamics are evolving. In later March, Iran allowed selective transit access for ships from China, Russia, India, Iraq, and Pakistan, with Malaysia and Thailand. While this provides limited relief, it also fragments global trade flows and creates unequal access to critical routes.
According to the Kuwait Petroleum Corp.'s CEO, Sheikh Nawaf al-Sabhis, the situation could take three to four months to return to normal even after the conflict is resolved.
This means the situation is here to stay and could set a new standard in the costs of oil and shipping.

There are three possible scenarios which could play out in the near future.
Scenario 1:
If the Strait of Hormuz opens up by mid-April, the prices of bunker oil could fall to between $700 and $800 a tonne. Emergency surcharges could begin to fall off. Logistical issues with spare parts could return to normal. However, the prices of insurance could continue to be high, and the backlog of repairs could take months to resolve.
Scenario 2:
If the situation continues into the second half of the year, the situation would become more severe.
This is because the Philippines has already declared a national energy emergency and depends on the Gulf for 98% of its oil supplies.
The global economic impact is already visible. According to Bloomberg Economics, US CPI rose to 3.4% year-on-year in March, up from 2.4% in February, largely driven by rising fuel costs.
At the same time, more than 44,000 businesses across 174 economies have already had at least one shipment exposed to disruption, highlighting the global reach of the crisis.
UNCTAD has warned of a situation where the costs of foodstuffs, manufacturing, and shipping could escalate due to the prolonged blockage of Strait of Hormuz. Developing countries would be the hardest hit.
At the same time, Singapore's bunker reserves would start to deplete. The reserves are currently maintained through low demand because of high prices. Nevertheless, when the reserves get to a critical level, even the largest bunkering centers would face a problem. This would disrupt the entire network.
Scenario 3:
Should the conflict spread further, affecting Saudi Arabia's oil installations such as Ras Tanura oil terminal, it would result in an unprecedented increase of the prices: $150-$200. In this case, the concept of affordable global shipping would become extinct. The shipping industry simply cannot withstand such price levels.
How the Industry Is Coping
The shipping industry finds itself in survival mode. To cope with it, following measures have been taken so far:
- Maersk is diverting fuel from costlier alternative sources and "slow steaming" (driving ships slower) to save oil. While this saves money, it increases transit times, making everything you buy take longer to arrive.
- The other option is the change in international regulations.
- Industry-wide shift to 30-day fuel procurement advance ordering, up from 10 days has become popular among ship owners.
- Ships have started Stockpiling of critical spares and diversification away from Middle East logistics hubs
- The International Maritime Organization held a special session with the purpose of discussing how to overcome this crisis strategically.
- Additionally, there are talks about transferring the center of gravity of the industry from Houston and Dubai toward Rotterdam and Singapore. However, moving a supertanker requires time.
Conclusion
Today, the marine supplies industry is facing a perfect storm. Previously, similar issues occurred in a localized manner, which meant partial destruction of certain links in the chain. In contrast to this, today, every aspect (fuel, insurance, spare parts and maintenance, routes) is affected. The human price of these changes is rather high. World Food Programme (WFP) warns that the threat of extreme hunger in Africa and Asia could rise to 17-25%, correspondingly.
Also, according to Dallas Federal Reserve research, losing 25% of Hormuz transit could cause global GDP shrinkage to 2.9%. This happens because the shipping process, spare parts delivery, and fuel supply are interrelated. If one link breaks, all others will suffer. Currently, every link in this chain is in dire straits. By mid-April we will see whether they will survive.
Written by: Saman Ali
Disclaimer:
This article is for informational and educational purposes only and does not constitute financial, investment, trading, or legal advice. Always do your own research or consult a licensed advisor before making trading decisions.
The War Premium: Why Oil Prices Will Not Come Down Anytime Soon

The War Premium: Why Oil Prices Will Not Come Down Anytime Soon
Think of it this way. The world's oil supply flows through a single corridor, a narrow, 21-mile stretch of water between Iran and Oman called the Strait of Hormuz. One in every five barrels of oil produced on earth passes through it. And right now, in late March 2026, that corridor is effectively shut down.
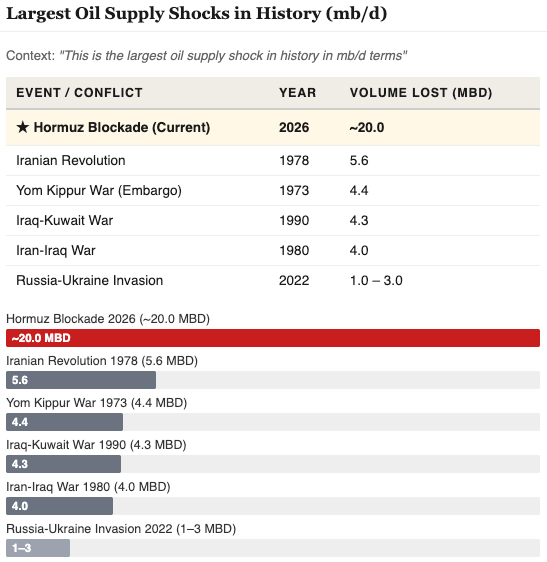
The consequences are not staying neatly contained to oil markets. They are showing up in your petrol bill, your food prices, and quietly, in the cost of every manufactured product that moves on a truck, making it the largest oil supply shocks in history. This piece breaks down what happened, why it matters, and where things go from here.
Where Prices Stand Right Now?
At first glance, the price table looks like any other volatile period in oil markets:
|
Benchmark |
Price |
30-Day Change |
|
Brent Crude (global standard) |
$107.34/bbl |
+34.2% |
|
WTI (U.S. domestic) |
$94.30/bbl |
+21.8% |
|
Dubai/Oman (Gulf physical) |
$111.45/bbl |
+41.0% |
But the number that actually tells you what is going on is not on that table. It is the $12.93 gap between Brent and WTI, the widest it has been since 2011.
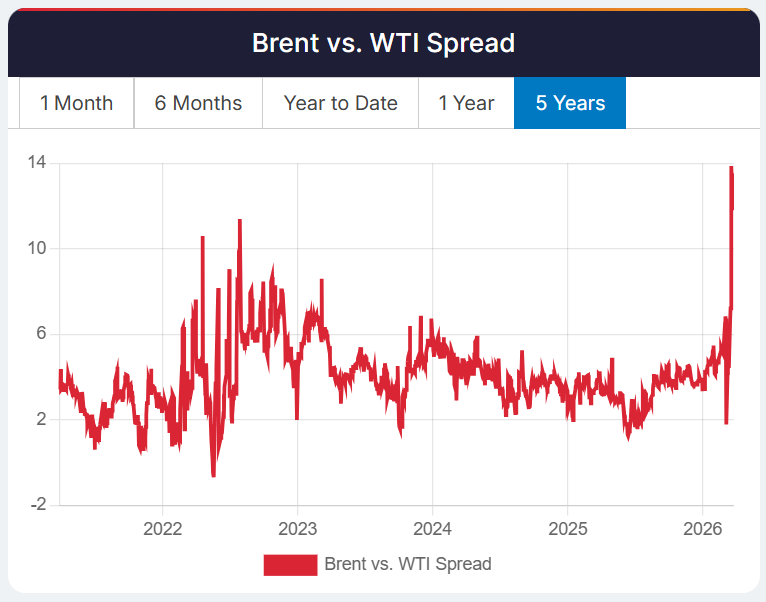
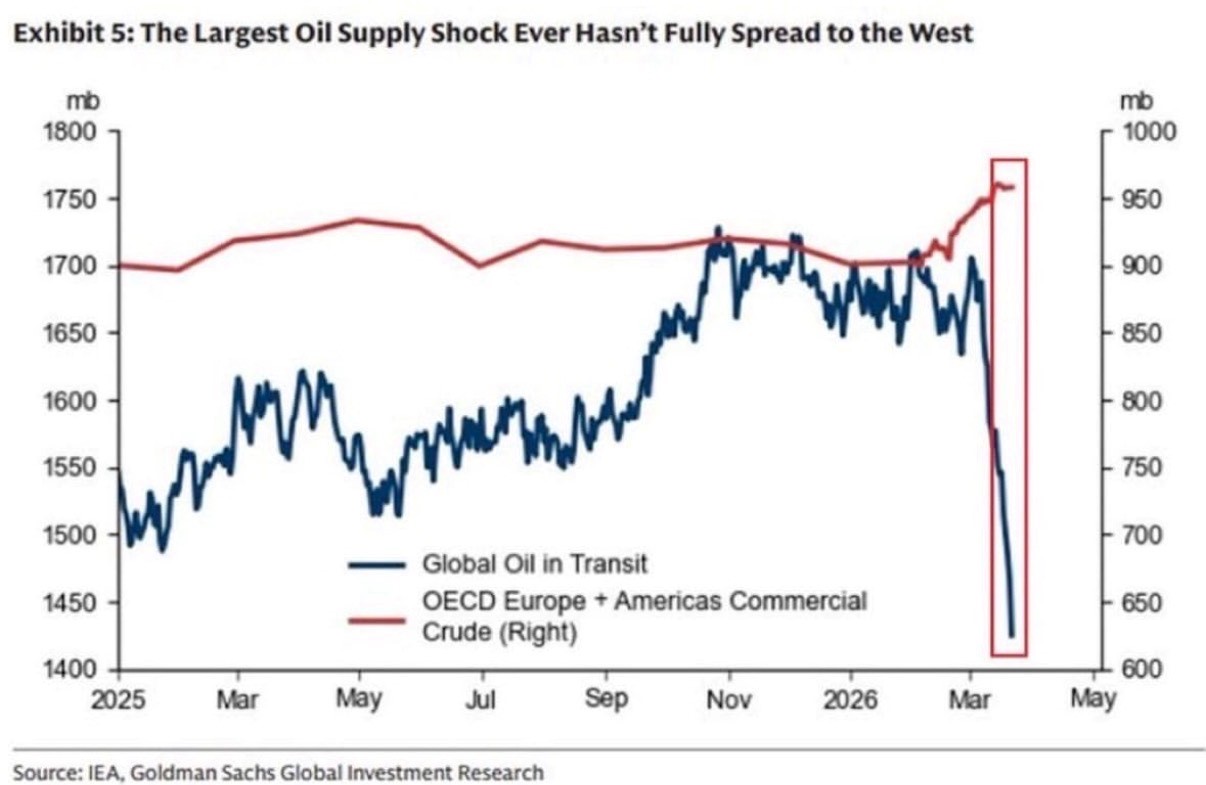
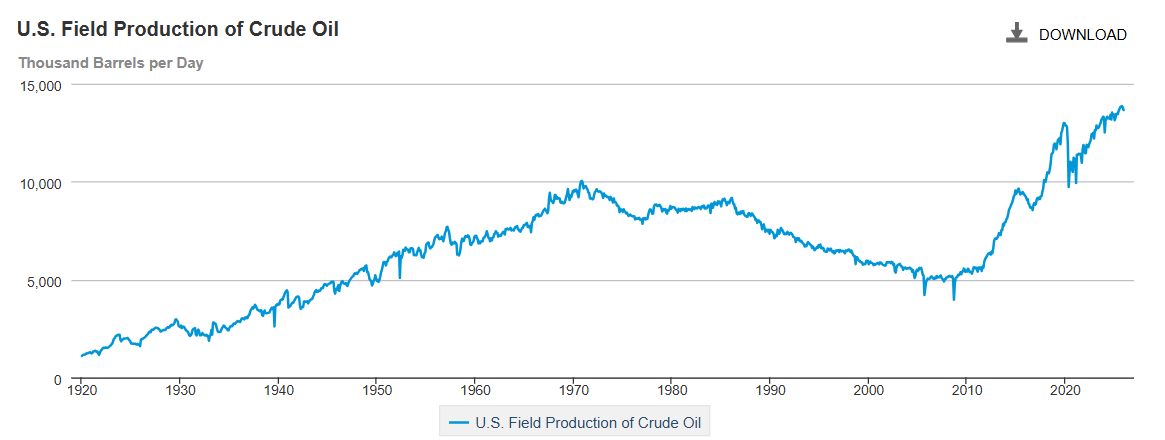
That gap is the market's way of saying: the United States, sitting on record domestic production of 13.7 mb/d, is living in a different energy reality right now than Europe and Asia. America is sheltered. The rest of the world is scrambling. That gap is the scramble made visible.
How Did We Get Here? Crisis Timeline
Nobody should pretend this came out of nowhere. But even people watching closely were caught off guard by the pace.
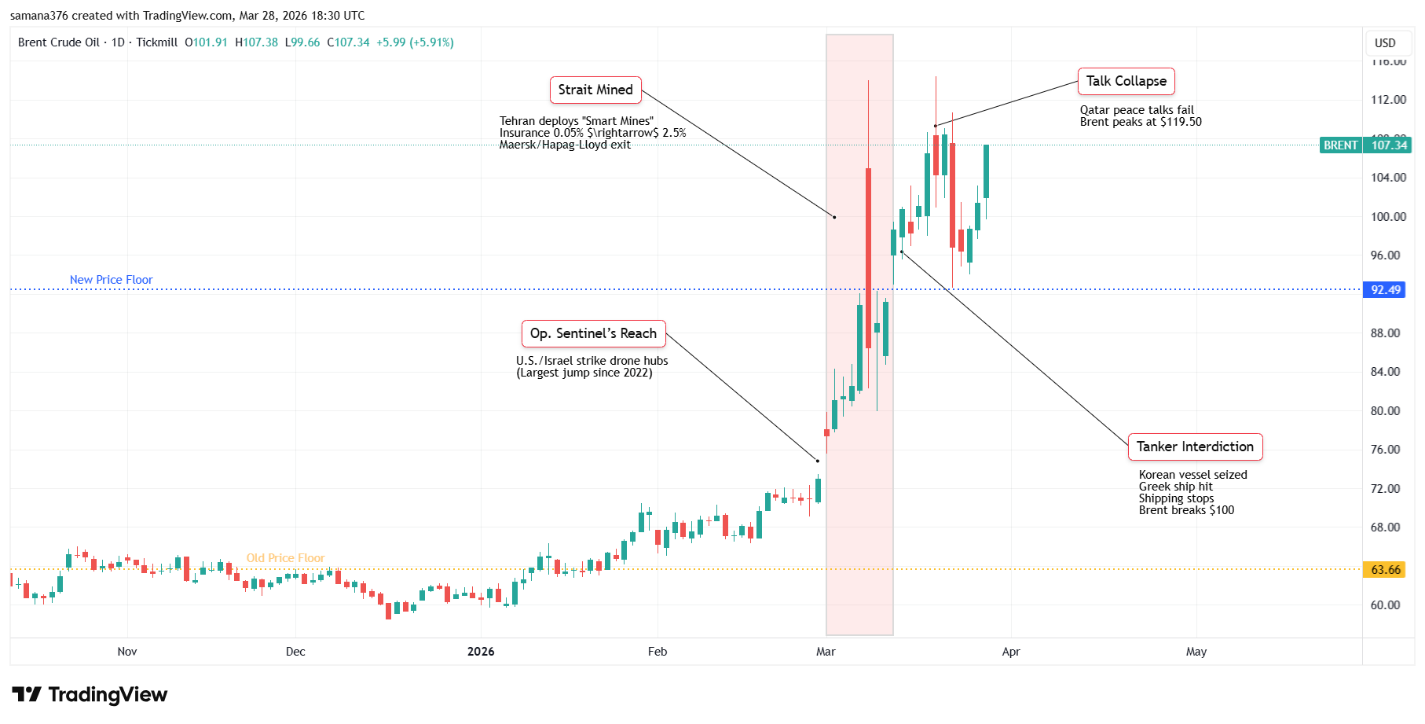
- February 28th was the ignition point. After a series of cyber attacks on regional infrastructure, U.S. and Israeli forces launched Operation Sentinel's Reach against Iranian drone manufacturing sites. Brent jumped $8.40 in twelve hours. That single session move was the largest since Russia invaded Ukraine in 2022.
- The first week of March is when it got structural. Tehran deployed what it calls "smart mines", remotely controlled naval mines, in the narrowest section of the Strait. Within days, shipping insurance costs went from 0.05% to 2.5% of a vessel's total value. Run that math on a $100 million oil tanker and a single voyage now costs $2.5 million just to insure, before you spend a dollar on fuel or crew. Maersk and Hapag-Lloyd, two of the world's largest shipping operators, pulled out of the Gulf entirely.
- March 12th ended any remaining ambiguity. A Korean tanker was seized. A Greek vessel took a hit from a loitering munition, essentially a slow drone that glides toward a target and detonates on contact. Commercial shipping didn't slow down. It stopped. Brent crossed $100 for the first time in four years.
- March 20th was supposed to bring some relief, with peace talks convening in Qatar. They collapsed. Markets drew the obvious conclusion, this is not a blip, and Brent ran to $119.50 before settling back to where it sits today at $108.16.
That pullback is worth addressing directly, because people are misreading it as a sign things are improving. They are not. The floor of this market has moved permanently higher. The retreat from $119 to $108 is not recovery. It is consolidation at a new, elevated baseline.
"Can't the Oil Just Go Another Way?"
It is the logical question, and the answer is: not really, no.
The world normally moves 21 mb/d through the Strait of Hormuz. The only two meaningful bypasses including the Abu Dhabi Crude Oil Pipeline (ADCOP) and Saudi Arabia's East-West Pipeline, can carry a combined 6.85 mb/d at full capacity.
That leaves a gap of over 14 mb/d. There is no pipeline being built, no fleet of trucks, and no emergency reserve large enough to bridge a hole that size. The math simply does not work.
The "Shut-In" Problem: The Crisis Behind the Crisis
Here is the part of this story that deserves far more attention than it is getting.
Gulf oil producers including Saudi Arabia, Kuwait, the UAE, operate almost entirely on a pump-and-ship model. They do not maintain large domestic stockpiles. They produce, and they export, almost simultaneously. So when ships stop moving, the oil has nowhere to go.
By March 15th, onshore storage across the Gulf had hit 95% of total working capacity. At that point, producers face a genuinely ugly choice: keep pumping into a full system, or shut the wells down.
Saudi Aramco has reportedly cut production by around 20%. The reason comes down to geology. Gulf oil fields sit in what are called carbonate rock formations, porous limestone structures where oil pressure and flow behavior are sensitive. Shut a well in this kind of formation improperly, or for too long, and you risk permanent productivity loss. Restarting can take six to twelve months. In some cases, the well never fully recovers.
So when people ask when supply will bounce back once the Strait reopens, the honest answer is: we do not know. Some of this supply may not bounce back at all.
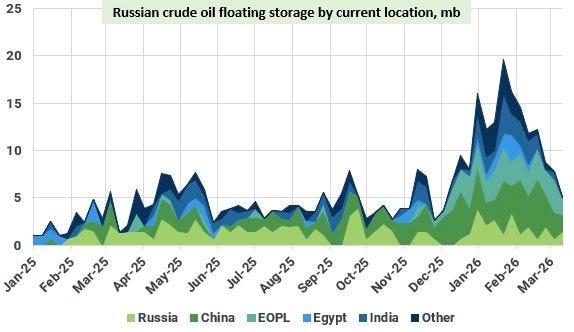
Meanwhile, over 300 supertankers aka VLCCs, the largest class of oil carrier in the world, are sitting idle outside the Gulf of Oman. They are full. The oil exists. The world just cannot get to it, partly because Iranian electronic warfare has filled the Strait's navigation environment with false GPS signals, making it unsafe for a vessel the size of four football fields to attempt the passage. Hence, the crude congestion is escalating.
So Why Isn't Oil at $200?
Three things are holding the price below that level, though none of them are permanent solutions.
- U.S. production is genuinely the biggest one. America pumping flat out at 13.7 mb/d has kept WTI below $100 and given Western buyers a real cushion. The catch is geography, a barrel leaving the U.S. Gulf Coast takes 25 to 30 days to reach Japan or South Korea. Asia's need is immediate. The barrel arrives next month.
- Emergency reserve releases helped calm the initial panic. The U.S. released 45.2 million barrels from its Strategic Petroleum Reserve on March 11th, coordinated with IEA member nations in one of the largest collective interventions the group has ever organized. It worked on market sentiment. It did not work on logistics. A barrel in a Texas reserve facility cannot physically appear in a Singaporean refinery within the week.
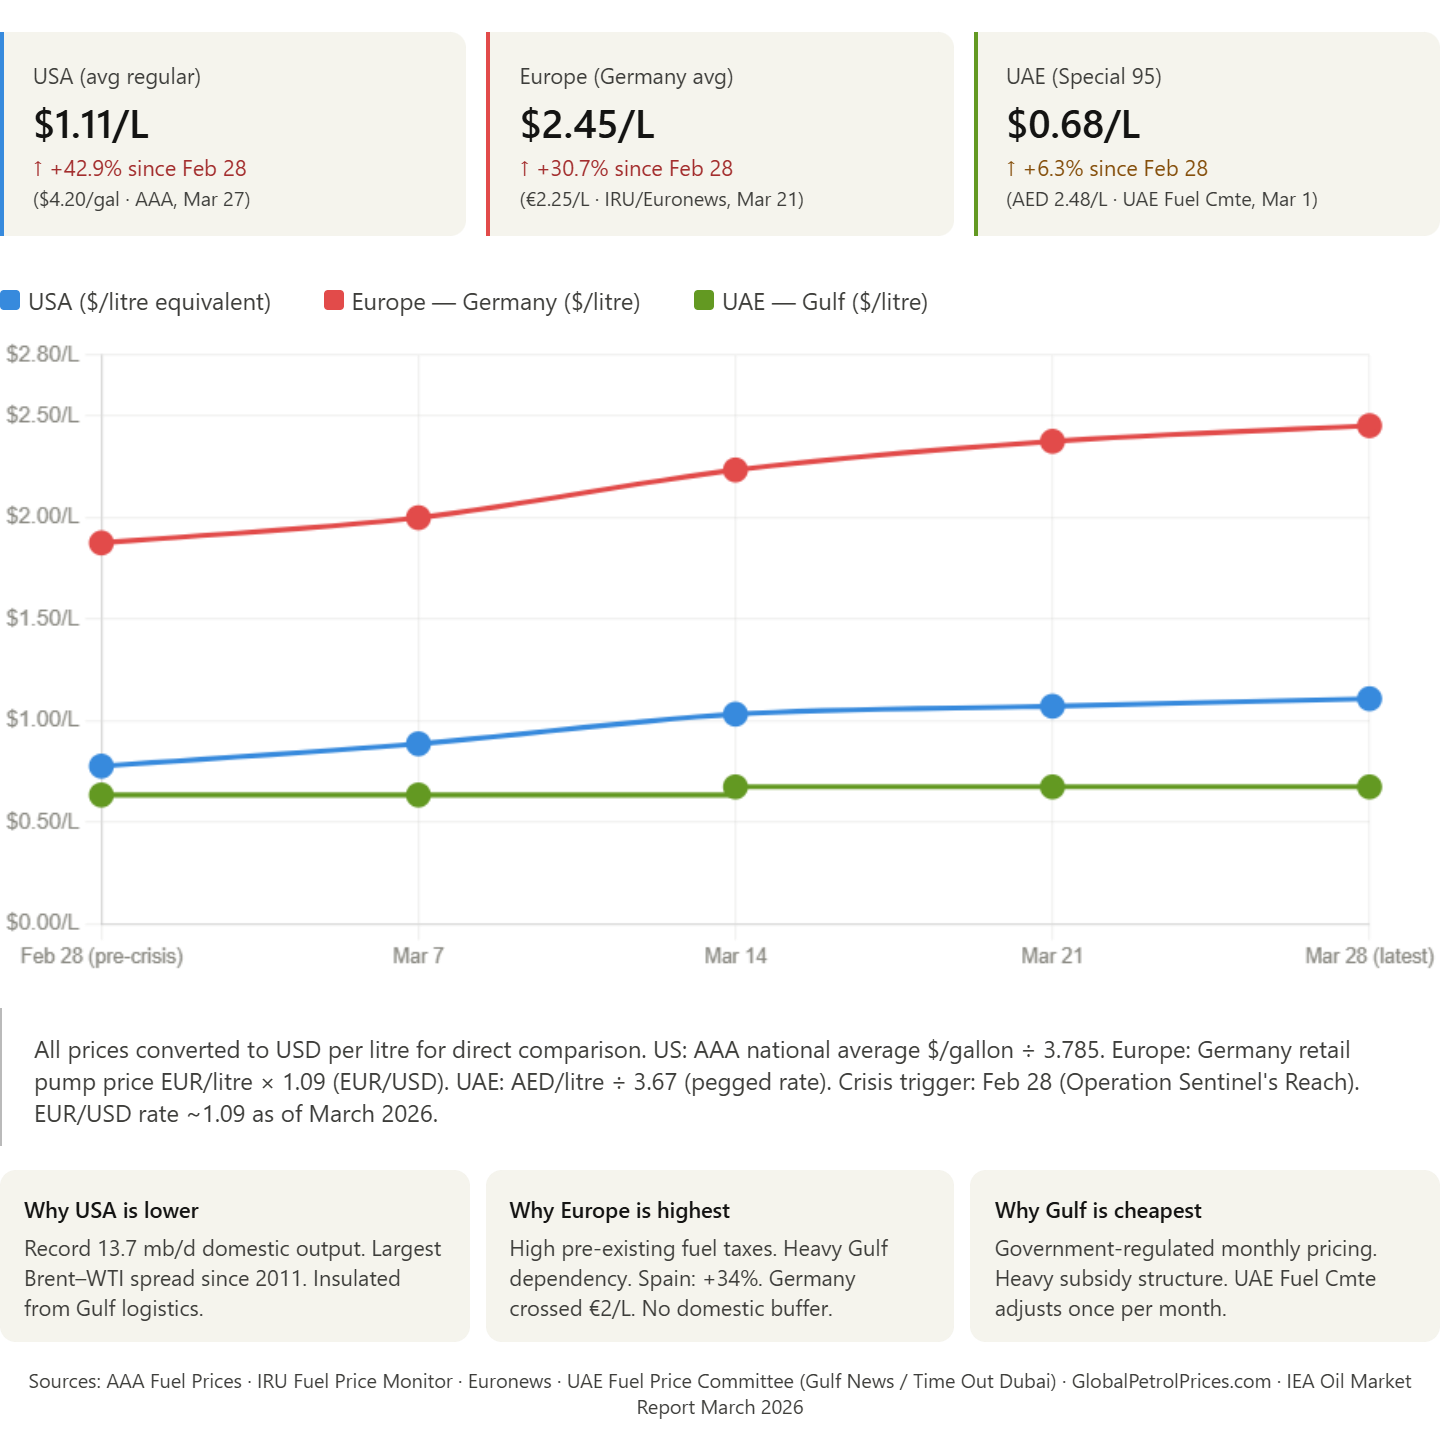
- Demand destruction is the bluntest mechanism of all, high prices forcing people to consume less. At $5.50 a gallon in the U.S. and €2.25 per litre across Europe, discretionary driving has dropped about 12% since late February. People are self-rationing. Prices slow their own rise by reducing consumption. The painful reality is that this adjustment is not distributed evenly. It lands hardest on households with the least financial flexibility and small businesses running on razor-thin margins.
Warflation" — Why This Is More Than an Oil Price Story Economists have landed on a new word for what is happening: Warflation. It describes something different from the inflation most people are familiar with, not too much money chasing too few goods, but military conflict physically destroying the supply chains that keep modern life running. The treatment is different. The trajectory is different. And the damage spreads further.
It is moving through three channels right now.
1- Diesel
Diesel is the first and most immediate. Despite crude sitting at $108, diesel is pricing as though oil were $160. The reason is that diesel requires specific grades of crude; heavier, denser varieties, which come predominantly from the Gulf and from Russian refineries. Those Russian facilities have been steadily degraded by Ukrainian drone strikes over eighteen months. Gulf supplies are now inaccessible. The global middle-distillate market, which powers every truck, train, and tractor on the planet, is functionally broken. The headline crude price understates the economic pressure by a significant margin.
2- Food
Food is the second channel, and it works through a supply chain most consumers never think about. Nitrogen fertilizers like urea, ammonium nitrate, are produced from natural gas, and their shortage will disrupt global food production. Qatar, one of the world's largest LNG exporters, has declared force majeure on its supply contracts. Major fertilizer producers including Yara International and CF Industries have warned of curtailments. Urea prices jumped 19% in a single week in mid-March. That number will show up in crop yields in Q3 2026, particularly across South Asia and the Middle East, regions that are already food price sensitive and have little economic buffer to absorb the shock.
3- Technology
Technology is the third, and the least obvious. TSMC, Taiwan's dominant semiconductor manufacturer, consumes approximately 6% of Taiwan's entire electricity supply. As LNG disruptions raise power generation costs on the island, chip production margins are being compressed. Reports of load-shedding agreements with smaller fabricators are emerging. The global supply chain for AI hardware, already operating with limited redundancy, is being quietly stressed by an energy crisis that started in the Persian Gulf.
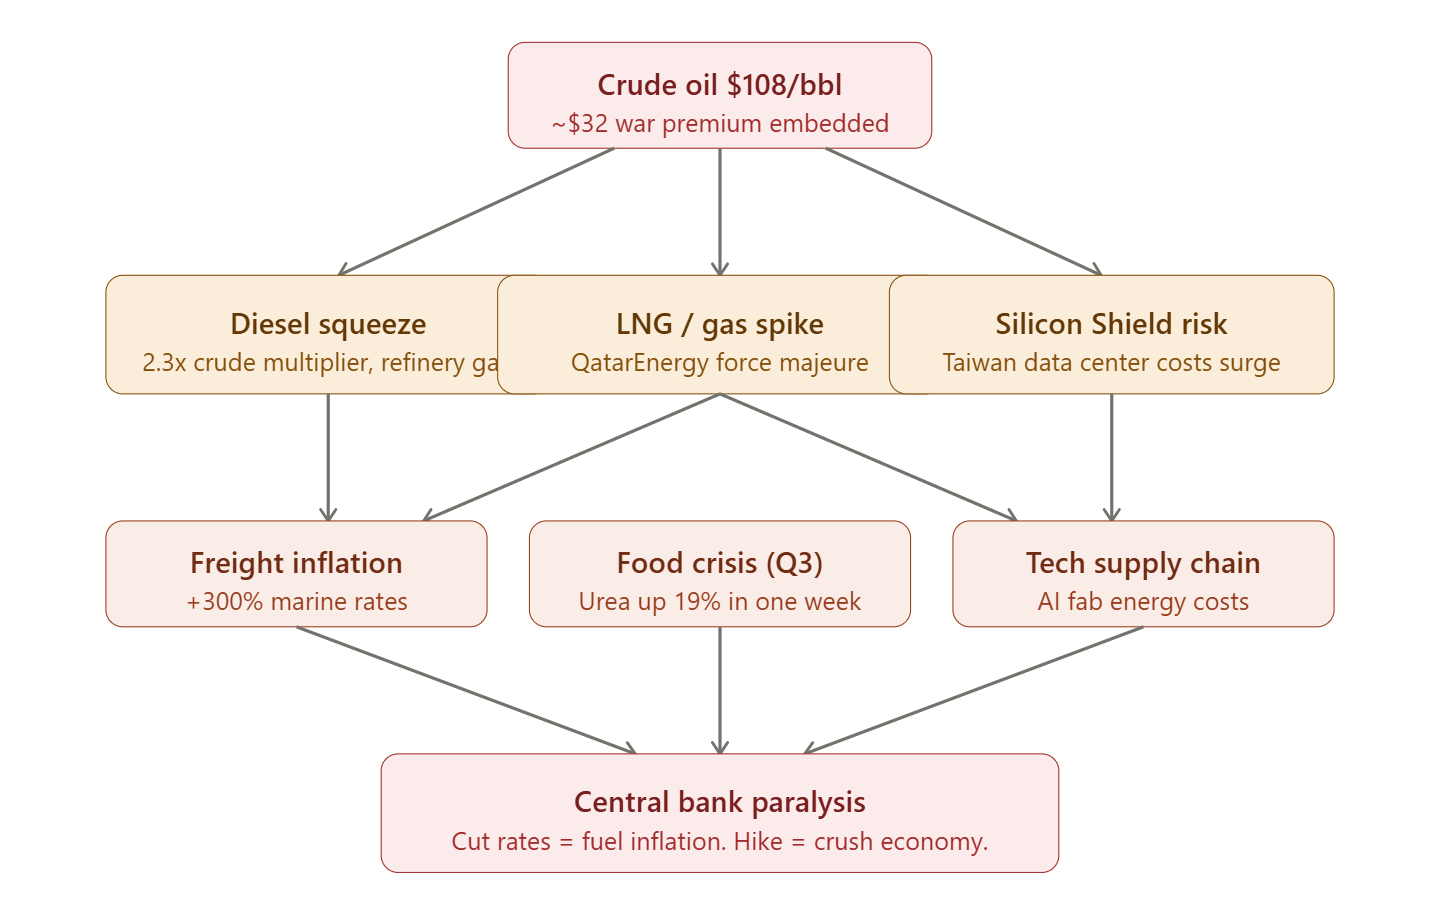
For central banks, all of this converges into a trap with no clean exit. Cut interest rates and you risk entrenching inflation. Raise them and you accelerate the economic contraction that high energy costs are already causing. Neither the Federal Reserve, nor the ECB, nor the Bank of England has a good move available right now.
Possible Ways This Ends – Future Scenarios
|
Scenario |
Probability |
Brent Price |
What It Means for You |
|
Fragile Truce — guarded naval corridor established |
45% |
$90–$105 |
Zero growth, persistent 5% inflation. Expensive, exhausting, but no collapse |
|
Full Escalation — strikes on Saudi oil infrastructure |
35% |
$150–$180 |
1970s-style recession. Trade seizures. Capital flight |
|
Peace Dividend — diplomatic breakthrough |
20% |
$65–$75 |
Markets rally hard. Inflation cools quickly. Central banks regain room to act |
The base case is not recovery. It is managed deterioration. The world learns to live with restricted supply, elevated prices, and structural inflation that refuses to shift. A heavily escorted maritime corridor keeps oil trickling through the Strait at reduced volumes and enormous cost. Growth stalls. Prices stay high. Nobody wins cleanly.
The escalation scenario at 35% is the one that keeps energy analysts genuinely worried. A strike on Saudi Arabia's Abqaiq processing complex — which handles around 7% of global crude supply — would not just block the pipe. It would damage the pump. The price response would be immediate and severe.
The peace scenario at 20% is real, but requires political developments that have no visible pathway right now.
Summing Up
For seven decades, the global oil system operated on one foundational assumption: oil that is produced will be delivered. Price moved. Delivery did not.
The Strait of Hormuz crisis has inverted that. Delivery is now the variable. No rate decision, no reserve release, and no reduction in driving habits can reopen a mined shipping lane or restart a shut-in well on a faster timeline than geology allows.
The winners of the 2026 economy will not be whoever finds the cheapest barrel. They will be whoever can guarantee that the barrel actually shows up.
Written by: Saman Ali

Claim your 50% Deposit Bonus with PU Prime, up to $10,000 by clicking HERE. Sponsored.
Disclaimer:
This article is for informational and educational purposes only and does not constitute financial, investment, trading, or legal advice. Always do your own research or consult a licensed advisor before making trading decisions.


